New high-resolution modelling predicts that rainfall from tropical cyclones will significantly increase under global warming. Earth Sciences New Zealand and the University of Waikato found that, under a high emissions scenario, extreme rainfall from cyclones could rise by up to 35% across the southwest Pacific, including for ex-tropical cyclones impacting Aotearoa New Zealand.
Researchers used the latest climate change projections released last year by Earth Sciences NZ (then NIWA) with the Ministry for the Environment. Study lead and climate scientist Dr Peter Gibson says they simulated more than 1,800 years of data from different climate models and levels of greenhouse gas emissions.
“We wanted to assess how the frequency and severity of tropical cyclones in the southwest Pacific may change by the end of the century. Under the full range of climate scenarios examined there was an increase in tropical cyclone rainfall. This was proportional to the rate of emissions, with the most pronounced rise in extreme rainfall occurring under the highest emissions.
“If that scenario plays out, we can expect around 30 – 35% more extreme rainfall during tropical cyclones than we experience today. Even under the best-case scenario, we will still see an increase proportional to the warming experienced. Extreme windspeeds are also likely to increase, but not to the same extent.”
The more greenhouse gases that are emitted, the higher temperatures get, with a high emissions scenario representing around a 3°C increase by the end of the century. A warmer atmosphere holds more water, so when storms develop, they have access to more water vapour that can be released as heavier rainfall.
And while the model simulations didn’t show an overall increase in the total number of cyclones by the end of the century, there is compelling evidence that the strongest (category 4 and above) will become more frequent.
“One or two ex-tropical cyclones typically effect New Zealand each year. However, it’s the really big, much rarer events that cause the most damage. And the difference between a river flooding or not can often be small, so any increase in rainfall is significant and potentially very impactful.
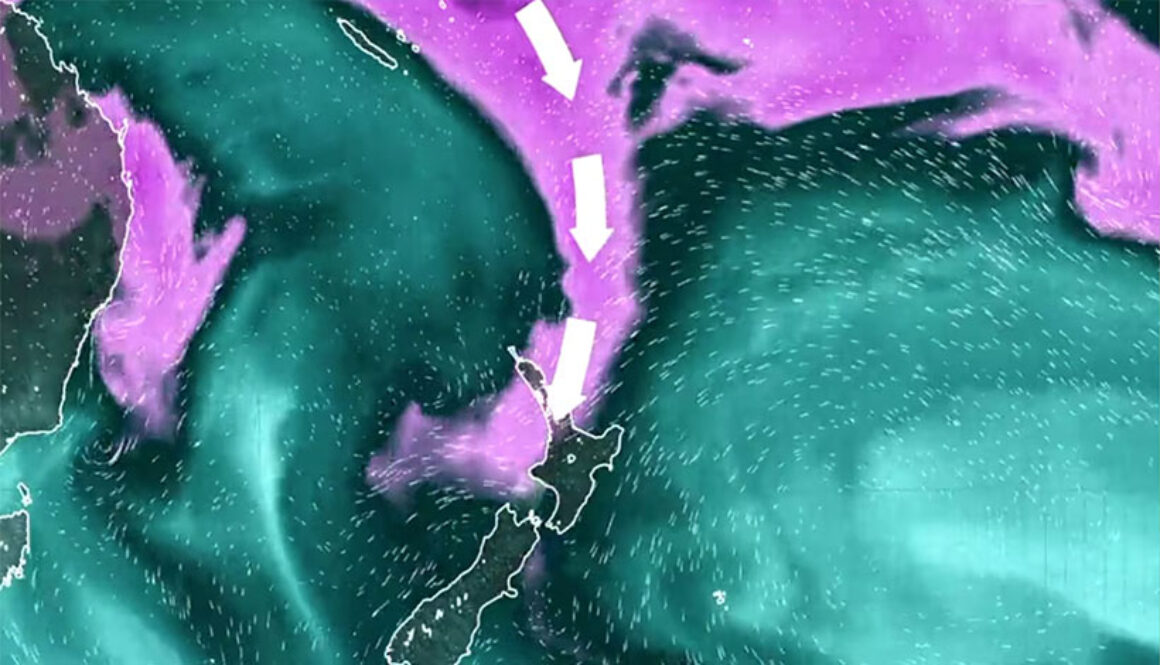
The February 2023 Cyclone Gabrielle [top image], which at its peak reached category 3, and the Auckland Anniversary weekend event, resulted in total estimated costs of $14.5 billion, with the total insured losses for both events totalling $3.8 billion, with $1.8 billion from Cyclone Gabrielle claims, and $2 billion from the Auckland anniversary weekend event. Most the claims were because of widespread flooding.
Until now, most projections of tropical cyclones have relied on global climate models, which have a relatively low spatial resolution. This work refines those models to a regional scale that can zoom in closer and get a much more accurate picture.
“The eye of a cyclone is fairly compact, at only tens of kilometres across. Global climate models are coarse, with each pixel going down to around 100km, meaning they miss much of the crucial detail and small-scale physics of a storm. Our refined regional model goes down to around a 12km resolution, making it a state-of-the-art dataset for assessing ex-tropical cyclones that impact New Zealand.”
These findings, published in the Journal of Geophysical Research: Atmospheres, are consistent with other studies around the world, highlighting the potential for more intense tropical cyclones and heavier rainfall in the future, said Dr Gibson. This indicates increasing risks for vulnerable communities across the southwest Pacific and New Zealand.
“It’s clear that if we reduce emissions, we reduce warming, and we mitigate the worst impacts of severe weather events. As computing capabilities improve, newer, high-resolution models will become available to create even more accurate and reliable long term climate projections of cyclones and their impacts. More research is being undertaken by Earth Sciences NZ into specific weather and climate hazards in the projections, to provide clarity on the future climate New Zealanders are likely to face in the decades to come.”
A groundbreaking Antarctic research expedition, led by New Zealand scientists, has for the first time directly observed water flowing out from beneath the West Antarctic Ice Sheet—revealing how massive, hidden floods beneath the ice are contributing to the melting of the continent’s largest ice shelves.
The findings, recently published in Nature Geoscience, offer dramatic new insights into how meltwater beneath Antarctica flows and affects sea level rise, says expedition lead Victoria University of Wellington Associate Professor Huw Horgan:
“Researchers have long suspected that water, from geothermal heat and other sources, flows from under the ice sheets. Satellite observations from elsewhere in West and East Antarctica have revealed active lakes under the ice caps. Our quest was not just to discover the network of hidden lakes and streams that can’t be seen from the surface, but to complete the first close-up observation of these watercourses meeting the ocean in cavities under the ice shelf. These sub-glacial watercourses play a central role in the melting of the ice shelf, so the findings will enable us to predict sea level rise more accurately.”
Supported by New Zealand’s Antarctic Science Platform, the scientists from NIWA, Victoria University, GNS Science and the University of Otago, as well as researchers in the UK and the US including Cornell University, undertook the fieldwork in the autumn of 2021. It took two weeks for the international team to travel from Scott Base 1,200 kilometres towards the Kamb Ice Stream across the Ross Ice Shelf, a floating ice sheet about the area of France.
“The first challenge was just to get there,” says Associate Professor Horgan, who also works in Switzerland for ETH Zurich’s Laboratory of Hydraulics, Hydrology and Glaciology.
“Fortunately, Antarctica New Zealand has developed long-range ice traverse capabilities to safely move people and gear over vast distances. The second challenge was drilling half a kilometre into the Kamb Ice Stream, a major glacier feeding into the Ross Ice Shelf. Vital to the expedition’s success were the skills of the drilling team from the Antarctic Research Centre at the Victoria University of Wellington who, using high-pressure hot water at 80°C, drilled a 500-metre-deep borehole through the Kamb Ice Stream.”
Drilling team from the Antarctic Research Centre at the Victoria University of Wellington. Image: NIWA
Once the team melted through the ice down into the ocean, they were able to film the under-ice watercourse and collect unique data on its temperature, salinity, sediment, and flow behaviour using a range of NIWA’s specialist ocean equipment—as well as Cornell University’s IceFin remotely operated vehicle.
Camera being lowered down through the ice. Image: NIWA
“With the help of our camera, we even
discovered a school of lobster-like (amphipods) creatures, 400
kilometres from the open ocean.”
The measurements provided many surprises for the team, says NIWA and
University of Auckland physical oceanographer Professor Craig Stevens:
“Our first discovery was the unique shape of the under-ice cavity where
the meltwater was flowing. The size of the watercourse—about 250 metres
deep and 150 metres wide—was larger than expected and mostly filled with
ocean water, with only a small portion being freshwater from beneath
the ice sheet.”
Using sediment cores the team concluded that the water comes from sub-glacial lakes upstream, which fill and empty the lakes in cycles – when they empty, a flood of water rushes towards the sea.
“Understanding these hidden systems is
crucial to improving climate models and predicting sea level rise more
accurately. The Ross Ice Shelf and others like it play a critical role
in slowing the flow of inland glaciers to the sea. Their decline will
significantly accelerate global sea level rise.”
“Antarctica may be remote, but what happens
there affects us all,” says Professor Stevens. “We need to understand
this distant changing environment, so we can prepare for future
challenges here at home.”
In my new research, I argue the time has come for the dairy sector to adopt a “just transition” framework to achieve a fair and more sustainable food future and to navigate the disruptions from alternative protein industries.
The concept of a just transition is typically applied to the energy sector in shifting from fossil fuels to renewable energy sources.
But a growing body of research and advocacy is calling for the same principles to be applied to food systems, especially for shifting away from intensive animal agriculture.
Aotearoa New Zealand’s dairy sector is an exemplary case study for examining the possibilities of a just transition because it is so interconnected in the global production and trade of dairy, with 95% of domestic milk production exported as whole-milk powder to more than 130 countries.
Environmental and economic challenges
New Zealand’s dairy sector faces significant threats. This includes environmental challenges such as alarming levels of nitrate pollution in waterways caused by intensive agriculture.
This means livestock farmers, agricultural processors, fertiliser importers and manufacturers won’t have to pay for on-farm emissions. Instead, the government intends to implement a pricing system outside the Emissions Trading Scheme by 2030. To meet emissions targets, it relies on the development of technologies such as methane inhibitors.
In addition to environmental challenges, global growth and domestic initiatives in the development of alternative dairy products are changing the future of milk production and consumption.
New Zealand dairy giant Fonterra is pursuing the growth of alternative dairy with significant investments in a partnership with Dutch multinational corporation Royal-DSM. This supports precision fermentation start-up Vivici, which already has market-ready products such as whey protein powder and protein water.
Fonterra’s annual report states it anticipates a rise in customer preference towards dairy alternatives (plant-based or precision-fermentation dairy) due to climate-related concerns. The company says these shifting preferences could pose significant business risks for future dairy production if sustainability expectations cannot be met.
Pathways to a just transition for dairy
What happens when one the pillars of the economy becomes a major contributor to environmental degradation and undermines its own sustainability? Nitrate pollution and methane emissions threaten the quality of the land and waterways the dairy sector depends on.
In my recent study which draws on interviews with people across New Zealand’s dairy sector, three key transition pathways are identified, which address future challenges and opportunities.
Deintensification: reducing the number of dairy cows per farm.
Diversification: introducing a broader range of farming practices, landuse options and market opportunities.
Dairy alternatives: government and industry support to help farmers
participate in emerging plant-based and precision-fermentation industries.
While the pathways are not mutually exclusive, they highlight the socioeconomic and environmental implications of rural change which require active participation and engagement between the farming community and policy makers.
The Ministry of Business, Innovation and Employment recently published a guide to just transitions. It maps out general principles such as social justice and job security.
For the dairy transition to be fair and sustainable, we need buy-in from leadership and support from government, the dairy sector and the emerging alternative dairy industry to help primary producers and rural communities. This needs to be specific to different regions and farming methods.
The future of New Zealand’s dairy industry depends on its ability to adapt. Climate adaptation demands balancing social license, sustainable practices and disruptions from novel protein technologies.
Atmospheric rivers are long filaments of moisture that curve poleward. Several are visible in this satellite image.
Bin Guan, NASA/JPL-Caltech and UCLA
Atmospheric rivers – those long, narrow bands of water vapor in the sky that bring heavy rain and storms to the U.S. West Coast and many other regions – are shifting toward higher latitudes, and that’s changing weather patterns around the world.
The shift is worsening droughts in some regions, intensifying flooding in others, and putting water resources that many communities rely on at risk. When atmospheric rivers reach far northward into the Arctic, they can also melt sea ice, affecting the global climate.
In a new study published in Science Advances, University of California, Santa Barbara, climate scientist Qinghua Dingand I show that atmospheric rivers have shifted about 6 to 10 degrees toward the two poles over the past four decades.
California relies on atmospheric rivers for up to 50% of its yearly rainfall. A series of winter atmospheric rivers there can bring enough rain and snow to end a drought, as parts of the region saw in 2023.
Atmospheric rivers occur all over the world, as this animation of global satellite data from February 2017 shows. NASA/Goddard Space Flight Center Scientific Visualization Studio
While atmospheric rivers share a similar origin – moisture supply from the tropics – atmospheric instability of the jet stream allows them to curve poleward in different ways. No two atmospheric rivers are exactly alike.
What particularly interests climate scientists, including us, is the collective behavior of atmospheric rivers. Atmospheric rivers are commonly seen in the extratropics, a region between the latitudes of 30 and 50 degrees in both hemispheres that includes most of the continental U.S., southern Australia and Chile.
Our study shows that atmospheric rivers have been shifting poleward over the past four decades. In both hemispheres, activity has increased along 50 degrees north and 50 degrees south, while it has decreased along 30 degrees north and 30 degrees south since 1979. In North America, that means more atmospheric rivers drenching British Columbia and Alaska.
The poleward movement of atmospheric rivers can be explained as a chain of interconnected processes.
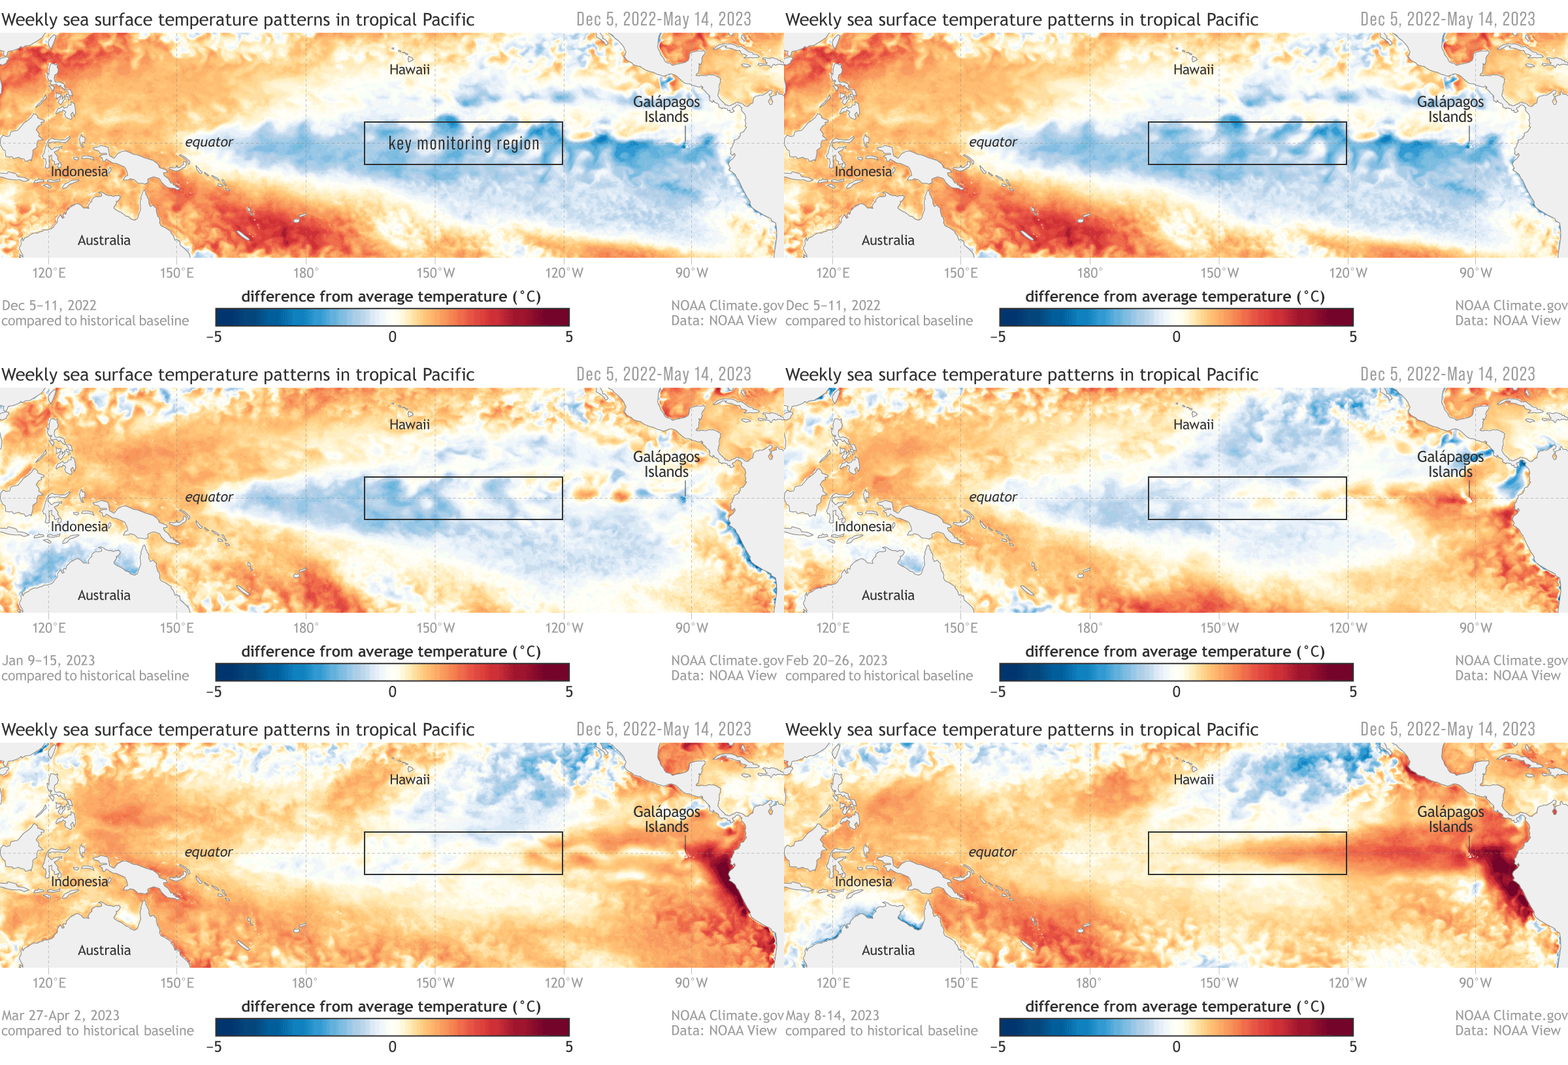
During La Niña conditions, when sea surface temperatures cool in the eastern tropical Pacific, the Walker circulation – giant loops of air that affect precipitation as they rise and fall over different parts of the tropics – strengthens over the western Pacific. This stronger circulation causes the tropical rainfall belt to expand. The expanded tropical rainfall, combined with changes in atmospheric eddy patterns, results in high-pressure anomalies and wind patterns that steer atmospheric rivers farther poleward.
La Niña, with cooler water in the eastern Pacific, fades, and El Niño, with warmer water, starts to form in the tropical Pacific Ocean in 2023.NOAA Climate.gov
Conversely, during El Niño conditions, with warmer sea surface temperatures, the mechanism operates in the opposite direction, shifting atmospheric rivers so they don’t travel as far from the equator.
The shifts raise important questions about how climate models predict future changes in atmospheric rivers. Current models might underestimate natural variability, such as changes in the tropical Pacific, which can significantly affect atmospheric rivers. Understanding this connection can help forecasters make better predictions about future rainfall patterns and water availability.
Why does this poleward shift matter?
A shift in atmospheric rivers can have big effects on local climates.
In the subtropics, where atmospheric rivers are becoming less common, the result could be longer droughts and less water. Many areas, such as California and southern Brazil, depend on atmospheric rivers for rainfall to fill reservoirs and support farming. Without this moisture, these areas could face more water shortages, putting stress on communities, farms and ecosystems.
In higher latitudes, atmospheric rivers moving poleward could lead to more extreme rainfall, flooding and landslides in places such as the U.S. Pacific Northwest, Europe, and even in polar regions.
A satellite image on Feb. 20, 2017, shows an atmospheric river stretching from Hawaii to California, where it brought drenching rain.NASA/Earth Observatory/Jesse Allen
In the Arctic, more atmospheric rivers could speed up sea ice melting, adding to global warming and affecting animals that rely on the ice. An earlier study I was involved in found that the trend in summertime atmospheric river activity may contribute 36% of the increasing trend in summer moisture over the entire Arctic since 1979.
What it means for the future
So far, the shifts we have seen still mainly reflect changes due to natural processes, but human-induced global warming also plays a role. Global warming is expected to increase the overall frequency and intensity of atmospheric rivers because a warmer atmosphere can hold more moisture.
How that might change as the planet continues to warm is less clear. Predicting future changes remains uncertain due largely to the difficulty in predicting thenatural swings between El Niño and La Niña, which play an important role in atmospheric river shifts.
As the world gets warmer, atmospheric rivers – and the critical rains they bring – will keep changing course. We need to understand and adapt to these changes so communities can keep thriving in a changing climate.
In media articles about unprecedented flooding, you’ll often come across the statement that for every 1°C of warming, the atmosphere can hold about 7% more moisture.
This figure comes from research undertaken by the French engineer Sadi Carnot and published 200 years ago this year.
We now know there’s more to the story. Yes, a hotter atmosphere has the capacity to hold more moisture. But the condensation of water vapour to make rain droplets releases heat. This, in turn, can fuel stronger convection in thunderstorms, which can then dump substantially more rain.
This means that the intensity of extreme rainfall could increase by much more than 7% per degree of warming. What we’re seeing is that thunderstorms can likely dump about double or triple that rate – around 14–21% more rain for each degree of warming.
For Australia, we helped develop a comprehensive review of the latest climate science to guide preparedness for future floods. This showed the increase per degree of global warming was about 7–28% for hourly or shorter duration extreme rain, and 2–15% for daily or longer extreme rain. This is much higher than figures in the existing flood planning standards recommending a general increase of 5% per degree of warming.
Why are thunderstorms important for extreme rain?
For thunderstorms to form, you need ingredients such as moisture in the air and a large temperature difference between lower and higher air masses to create instability.
We typically associate thunderstorms with intense localised rain over a short period. What we’re seeing now, though, is a shift towards more intense thunderstorm downpours, particularly for short periods.
Extreme rain events are also more likely when thunderstorms form in combination with other weather systems, such as east coast lows, intense low pressure systems near eastern Australia. The record floods which hit Lismore in February 2022 and claimed the lives of many people came from extreme rain over many days, which came in part from severe thunderstorms in combination with an east coast low.
Climate change pumps up extreme flood risk factors
The latest report from the Intergovernmental Panel on Climate Change (IPCC) states that:
frequency and intensity of heavy precipitation events have increased since the 1950s over most land areas for which observational data are sufficient for trend analysis (high confidence), and human-induced climate change is likely the main driver
This increase is particularly clear in short-duration extreme rains, such as those caused by thunderstorms.
Why? In part, it’s because of the 7% figure – warmer air is able to hold more water vapour.
But that doesn’t explain everything. There’s something else going on. Condensation produces heat. So as water vapour turns into droplets, more heat becomes available, and hot air rises by convection. In thunderstorms, more heat fuels stronger convection, where warm, moisture-laden air is driven up high.
This explains why thunderstorms can now drive such extreme rainfall in our warming world. As water vapour condenses to make rain, it also makes heat, supercharging storms.
We are seeing these very rapid rates of rainfall increase in recent decades in Australia.
Daily rainfall associated with thunderstorms has increased much more than the 7% figure would suggest – about 2-3 times more.
What about very sudden, extreme rains? Here, the rate of increase could potentially be even larger. One recent study examined extreme rain for periods shorter than one hour near Sydney, suggesting about a 40% increase or more over the past 20 years.
Rapid trends in extreme rainfall intensity are also clear in other lines of evidence, such as fine-resolution modelling.
To model complex climate systems, we need the grunt of supercomputers. But even so, many of our models for climate projections don’t drill down to grid resolutions smaller than about 100 kilometres.
While this can work well for large-scale climate modelling, it’s not suitable for directly simulating thunderstorms. That’s because the convection processes needed to make thunderstorms form happen on much smaller scales than this.
There’s now a concerted effort underway to perform more model simulations at very fine scales, so we can improve the modelling of convection.
Recent results from these very fine scale models for Europe suggest convection will play a more important role in triggering extreme rainfall including in combined storms, such as thunderstorms mingling with low pressure systems and other combinations.
This matches Australian observations, with a trend towards increased rain from thunderstorms combining with other storm types such as cold fronts and cyclones (including low-pressure systems in southern Australia).
Does this change how we plan for floods?
The evidence for supercharged thunderstorm rainfall has grown in recent years.
Australia’s current flood guidance recommendations, which influence how infrastructure projects have been built, are based on extreme rain increasing by just 5% for each degree of warming.
Our research review has shown the real figure is substantially higher.
This means roads, bridges, tunnels built for the 5% figure may not be ready to deal with extreme rain we are already seeing from supercharged thunderstorms.
This will have to change. We still face some uncertainties in precisely linking climate change to a single extreme rain event. But the bigger picture is now very clear: a hotter world is likely one with higher risk of extreme floods, often driven by extreme rain from supercharged thunderstorms.
So what should we do? The first step is to take climate change influences on storms and flood risk as seriously as we now do for bushfires.
The next is to embed the best available evidence in how we plan for these future storms and floods.
We have already loaded the dice for more extreme floods, due to existing human-caused climate change and more to come, unless we can quickly reduce our greenhouse gas emissions.
We can’t just sit around and wait to see what will happen next. We need positive action.
I’ve read a lot of Climate Adaptation Plans and Strategies over the past the last few years, but He Toka Tū Moana Mō Maketū (Maketū Climate Change Adaptation Plan) is hand-down the best. It’s clearly laid out, outlines the community’s priorities, and can readily serve as a template to help every community around Aoteara develop their own Climate Adaptation Plans. Most important of all:
It’s iwi led, community driven, it’s a plan that’s been decided by those who live here. – Elva Conroy, Kaitohotohu / Facilitator (Video; to listen Watch on Youtube)
In the words of the Maketu Iwi Collective, ‘we will be resilient like the anchor stone Takaparore – strong and steadfast against the elements and tides of change and uncertainty. Regardless of what happens as a result of a changing environment, we will remain standing’. – New Zealand Planning Institute, April 2023.
By definition, braided rivers are made up of multiple channels or ‘braids’. Systematically forcing them into the solitary confinement of single channels is turning them into what University of Waikato’s Professor James Brasington calls “zombie” rivers, waterways locked into position between stopbanks and their headwaters. Planting willows and poplars as a ‘natural’ way to hold them in place has just exacerbated the problem. Confining braided rivers not only creates problems for freshwater ecosystems including habitat for braided river birds, it also makes these rivers prone to catastrophic flooding.
“If we put our rivers into straight-jackets, they lose the diversity of form and process that are fundamental to the creation of thriving ecosystems. Instead, we should make space for rivers to erode their corridors, flood naturally in areas that are of less value which will in turn, reduce risks in more sensitive areas. We must work with natural processes to reduce the flood risk and support healthy river ecosystems.” – James Brassington
Last weekend, several zombie rivers in Canterbury broke free and invaded towns and properties.
It’s not like we weren’t warned. In 2019, NIWA published this extraordinarily well-ignored report outlining the current NZ$40 billion flood risks to Canterbury (no, that’s no a misprint; it’s billion, not million) (Fig. 2) .
Fig. 2: From 2019 NIWA’s 2019 report, ‘New Zealand Fluvial and Pluvial Flood Exposure’ (page 8). Exposure to flood risk does not mean all of the areas on the map (click the image) will flood. However, the risks are increasing as the climate changes as warmer air carries more moisture.
I’ve yet to meet anyone who read their entire report, much less acted on it. A small extract made headline news in a North Canterbury paper and was promptly forgotten.
Two weeks ago, I gave a presentation to the Waimakariri drainage group on the risks of flooding from pluvial and fluvial events and rising sea levels. It caused some discomfort, but then again, I was talking about climate change. A concept that probably seemed too remote to lose much sleep over.
Last weekend’s floods will no doubt make headline news again in our local papers. And in a few weeks it will also probably be forgotten by most people, especially those who weren’t directly affected. Part of the reason is that the phrase ‘1-in-100 event’ is often misunderstood, leading to a false sense of security that these zombies and their big brother rivers are unlikely to escape again in our lifetimes. (The term ‘1-in-100 years’ is in fact a statistical annual exceedance probability. It’s arguably moot in any case as many hydrologists consider stationarity to be dead.)
And then there’s the false perception that ECan is obligated to shove every metre of rivers back into solitary confinement. The situation on the Okuku River is a case in point. The poor little Okuku, like many zombie rivers, is so glutted with weeds that it’s unrecognisable as a braided river. It’s not even mentioned on the braided rivers website. I mention it here now, because this section of the Okuku is outside the river ratings area. Councils are under no obligation to protect those who live and farm in its riverbed. At some point, properties in riverbeds are likely to be deemed too risky to insure, which raises the question of who will pay for more extreme weather events? And how can we tell if climate change is the cause?
“We shouldn’t be surprised when our rivers break their banks — that’s just a river being a river. Current management practices in Aotearoa treat rivers as static, in the hope of making them more predictable.
“But this can lead to disasters.
“Unless we change management practices to work with a river, giving it space to move and allowing channels to adjust, we will continue to put people and rivers on a collision course.
“When flood risk is managed poorly, disadvantaged groups of the population are often disproportionately impacted. Given climate change predictions of more extreme floods and drought, the problem will only get worse.”
One of the authors of this article, Dr Jo Hoyle from NIWA, will be presenting a paper at the next Braided Rivers seminar at Lincoln University Wednesday 14 July. If you are reading this after the event, a PDF of her presentation will be available here.
For more information see the pages on this website: