The COP28 climate summit in Dubai has adjourned. The result is “The UAE consensus” on fossil fuels.
This text, agreed upon by delegates from nearly 200 countries, calls for the world to move “away from fossil fuels in energy systems in a just, orderly and equitable manner”. Stronger demands to “phase out” fossil fuels were ultimately unsuccessful.
The agreement also acknowledges the need to phase down “unabated” coal burning and transition towards energy systems consistent with net zero emissions by 2050, while accelerating action in “the critical decade” of the 2020s.
As engineers and scientists who research the necessary changes to pull off this energy system transition, we believe this agreement falls short in addressing the use of fossil fuels at the heart of the climate crisis.
Such an approach is inconsistent with the scientific consensus on the urgency of drastically reducing fossil fuel consumption to limit global warming to 1.5°C.
‘Abated’ v ‘unabated’
The combustion of coal, oil and gas accounts for 75% of all global warming to date – and 90% of CO₂ emissions.
So what does the text actually ask countries to do with these fuels – and what loopholes might they exploit to continue using them well into the future?
Those countries advocating for the ongoing use of fossil fuels made every effort to add the term “unabated” whenever a fossil fuel phase-down or phase-out was proposed during negotiations.
“Abatement” in this context typically means using capture capture and storage technology to stop CO₂ emissions from engines and furnaces reaching the atmosphere.
However, there is no clear definition of what abatement would entail in the text. This ambiguity allows for a broad and and easily abused interpretation of what constitutes “abated” fossil fuel use.
Will capturing 30% or 60% of CO₂ emissions from burning a quantity of coal, oil or gas be sufficient? Or will fossil fuel use only be considered “abated” if 90% or more of these emissions are captured and stored permanently along with low leakage of “fugitive” emissions of the potent greenhouse gas methane, which can escape from oil and gas infrastructure?
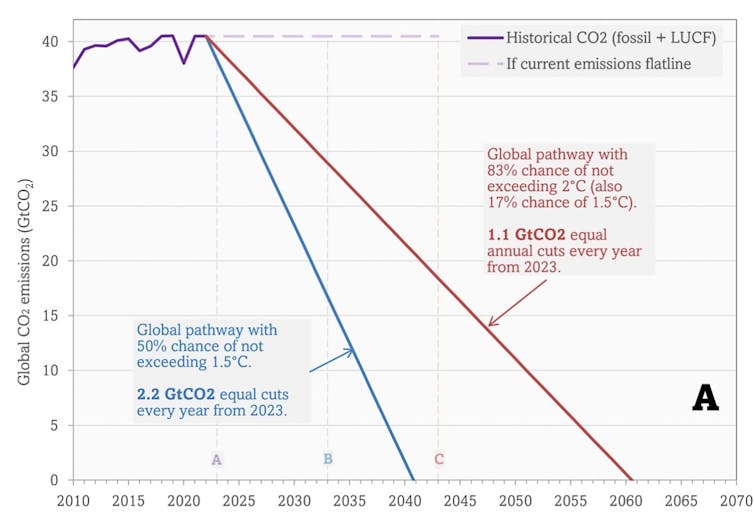
This is important. Despite the agreement supposedly honouring “the science” on climate change, low capture rates with high residual and fugitive emissions are inconsistent with what research has shown is necessary to limit global warming to the internationally agreed guardrails of 1.5°C and 2°C above pre-industrial temperatures.
In a 2022 report, the Intergovernmental Panel on Climate Change (IPCC) indicated that almost all coal emissions and 33%-66% of natural gas emissions must be captured to be compatible with the 2015 Paris agreement.
That’s assuming that the world will have substantial means of sucking carbon (at least several billion tonnes a year) from the air in future decades. If these miracle machines fail to materialise, our research indicates that carbon capture would need to be near total on all fuels.
The fact that the distinction between “abated” and “unabated” fossil fuels has not been clarified is a missed opportunity to ensure the effectiveness of the Dubai agreement. This lack of clarity can prolong fossil fuel dependence under the guise of “abated” usage.
This would cause wider harm to the transition by allowing continued investment in fossil fuel infrastructure – new coal plants, for instance, as long as some of the carbon they emit is captured (abated) – thereby diverting resources from more sustainable power sources. This could hobble COP28’s other goal: to triple renewable energy capacity by 2030.
By not explicitly defining these terms, COP28 missed the chance to set a firm, scientifically-backed benchmark for future fossil fuel use.
The coming age of carbon dioxide removal
Since the world is increasingly likely to overshoot the temperature goals of the Paris agreement, we must actively remove more CO₂ from the atmosphere – with reforestation and direct air capture (DAC), among other methods – than is emitted in future.
Some carbon removal technologies, such as DAC, are very early in their development and scaling them up to remove the necessary quantity of CO₂ will be difficult. And this effort should not detract from the urgent need to reduce emissions in the first place. This balanced approach is vital to not only halt but reverse the trajectory of warming, aligning with the ambitious goals of the Paris agreement.
There has only really been one unambiguously successful UN climate summit: Paris 2015, when negotiations for a top-down agreement were ended and the era of collectively and voluntarily raising emissions cuts began.
A common commitment to “phase down and then out” clearly defined unabated fossil fuels was not reached at COP28, but it came close with many parties strongly in favour of it. It would not be surprising if coalitions of like-minded governments proceed with climate clubs to implement it.