A groundbreaking Antarctic research expedition, led by New Zealand scientists, has for the first time directly observed water flowing out from beneath the West Antarctic Ice Sheet—revealing how massive, hidden floods beneath the ice are contributing to the melting of the continent’s largest ice shelves.
The findings, recently published in Nature Geoscience, offer dramatic new insights into how meltwater beneath Antarctica flows and affects sea level rise, says expedition lead Victoria University of Wellington Associate Professor Huw Horgan:
“Researchers have long suspected that water, from geothermal heat and other sources, flows from under the ice sheets. Satellite observations from elsewhere in West and East Antarctica have revealed active lakes under the ice caps. Our quest was not just to discover the network of hidden lakes and streams that can’t be seen from the surface, but to complete the first close-up observation of these watercourses meeting the ocean in cavities under the ice shelf. These sub-glacial watercourses play a central role in the melting of the ice shelf, so the findings will enable us to predict sea level rise more accurately.”
Supported by New Zealand’s Antarctic Science Platform, the scientists from NIWA, Victoria University, GNS Science and the University of Otago, as well as researchers in the UK and the US including Cornell University, undertook the fieldwork in the autumn of 2021. It took two weeks for the international team to travel from Scott Base 1,200 kilometres towards the Kamb Ice Stream across the Ross Ice Shelf, a floating ice sheet about the area of France.
“The first challenge was just to get there,” says Associate Professor Horgan, who also works in Switzerland for ETH Zurich’s Laboratory of Hydraulics, Hydrology and Glaciology.
“Fortunately, Antarctica New Zealand has developed long-range ice traverse capabilities to safely move people and gear over vast distances. The second challenge was drilling half a kilometre into the Kamb Ice Stream, a major glacier feeding into the Ross Ice Shelf. Vital to the expedition’s success were the skills of the drilling team from the Antarctic Research Centre at the Victoria University of Wellington who, using high-pressure hot water at 80°C, drilled a 500-metre-deep borehole through the Kamb Ice Stream.”
Drilling team from the Antarctic Research Centre at the Victoria University of Wellington. Image: NIWA
Once the team melted through the ice down into the ocean, they were able to film the under-ice watercourse and collect unique data on its temperature, salinity, sediment, and flow behaviour using a range of NIWA’s specialist ocean equipment—as well as Cornell University’s IceFin remotely operated vehicle.
Camera being lowered down through the ice. Image: NIWA
“With the help of our camera, we even
discovered a school of lobster-like (amphipods) creatures, 400
kilometres from the open ocean.”
The measurements provided many surprises for the team, says NIWA and
University of Auckland physical oceanographer Professor Craig Stevens:
“Our first discovery was the unique shape of the under-ice cavity where
the meltwater was flowing. The size of the watercourse—about 250 metres
deep and 150 metres wide—was larger than expected and mostly filled with
ocean water, with only a small portion being freshwater from beneath
the ice sheet.”
Using sediment cores the team concluded that the water comes from sub-glacial lakes upstream, which fill and empty the lakes in cycles – when they empty, a flood of water rushes towards the sea.
“Understanding these hidden systems is
crucial to improving climate models and predicting sea level rise more
accurately. The Ross Ice Shelf and others like it play a critical role
in slowing the flow of inland glaciers to the sea. Their decline will
significantly accelerate global sea level rise.”
“Antarctica may be remote, but what happens
there affects us all,” says Professor Stevens. “We need to understand
this distant changing environment, so we can prepare for future
challenges here at home.”
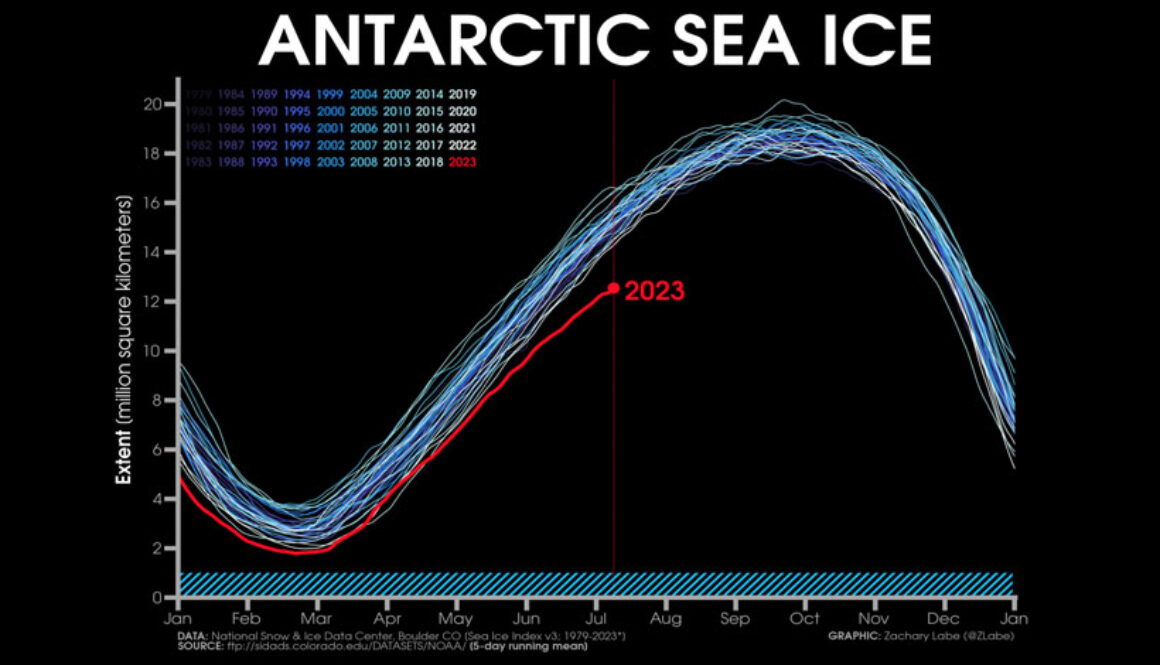
Over the past four summers, Antarctic sea ice extent has hit new lows.
I’m part of a large group of scientists who set out to explore the consequences of summer sea ice loss after the record lows of 2022 and 2023. Together we rounded up the latest publications, then gathered new evidence using satellites, computer modelling, and robotic ocean sampling devices. Today we can finally reveal what we found.
It’s bad news on many levels, because Antarctic sea ice is vital for the world’s climate and ecosystems. But we need to get a grip on what’s happening – and use this concerning data to prompt faster action on climate change.
Sea ice around Antarctica waxes and wanes with the seasons, growing in the cold months and melting in warm ones. But this rhythmic cycle is changing.
What we did and what we found
Our team used a huge range of approaches to study the consequences of sea ice loss.
We used satellites to understand sea ice loss over summer, measuring everything from ice thickness and extent to the length of time each year when sea ice is absent.
Satellite data was also used to calculate how much of the Antarctic coast was exposed to open ocean waves. We were then able to quantify the relationship between sea ice loss and iceberg calving.
Data from free-drifting ocean robots was used to understand how sea ice loss affects the tiny plants that support the marine food web.
Every other kind of available data was then harnessed to explore the full impact of sea ice changes on ecosystems.
We also used computer models to simulate the impact of dramatic summer sea ice loss on the ocean.
In summary, our extensive research reveals four key consequences of summer sea ice loss in Antarctica.
1. Ocean warming is compounding
Bright white sea ice reflects about 90% of the incoming energy from sunlight, while the darker ocean absorbs about 90%. So if there’s less summer sea ice, the ocean absorbs much more heat.
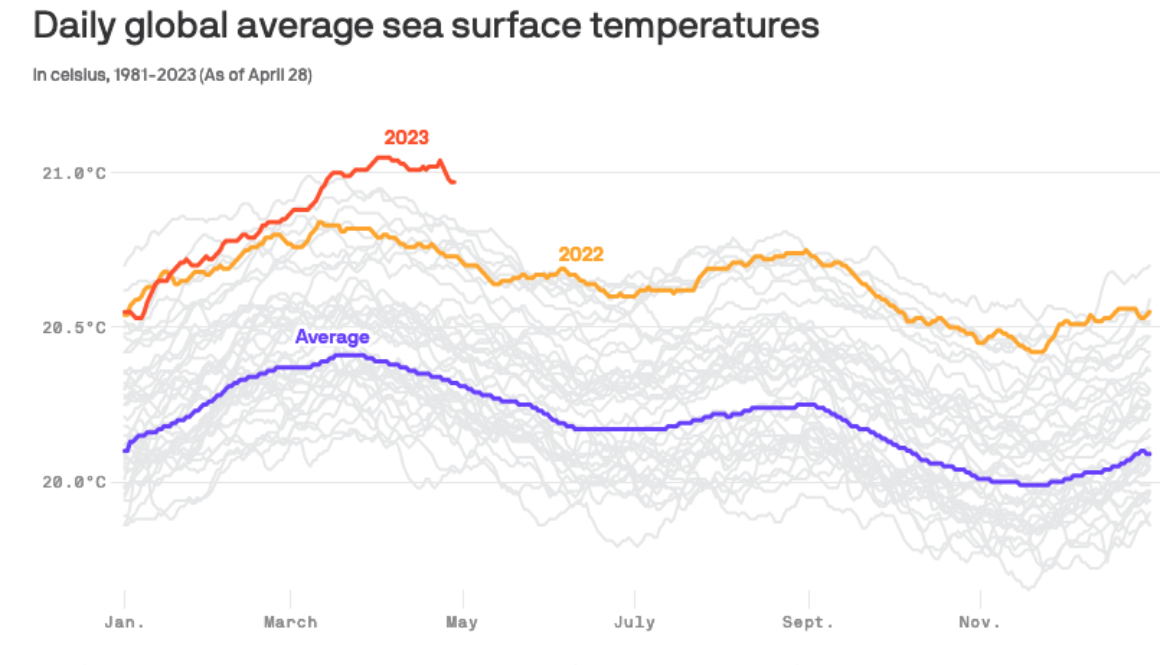
This means the ocean surface warms more in an extreme low sea ice year, such as 2016 – when everything changed.
Until recently, the Southern Ocean would reset over winter. If there was a summer with low sea ice cover, the ocean would warm a bit. But over winter, the extra heat would shift into the atmosphere.
That’s not working anymore. We know this from measuring sea surface temperatures, but we have also confirmed this relationship using computer models.
What’s happening instead is when summer sea ice is very low, as in 2016, it triggers ocean warming that persists. It takes about three years for the system to fully recover. But recovery is becoming less and less likely, given warming is building from year to year.
Comparing an average sea ice summer (a) to an extreme low sea ice summer (b) in which there is less sea ice for wildlife and more sunlight is absorbed by the ocean. The ice shelf is more exposed to ocean waves, calving more icebergs. The ocean is also less productive and tourist vessels can make a closer approach.Doddridge, E., W., et al. (2025) PNAS Nexus., CC BY-NC-ND
2. More icebergs are forming
Sea ice protects Antarctica’s coast from ocean waves.
On average, about a third of the continent’s coastline is exposed over summer. But this is changing. In 2022 and 2023, more than half of the Antarctic coast was exposed.
Our research shows more icebergs break away from Antarctic ice sheets in years with less sea ice. During an average summer, about 100 icebergs break away. Summers with low sea ice produce about twice as many icebergs.
Antarctic ice sheets without sea ice are more exposed to waves. Pete Harmsen AAD
3. Wildlife squeezed off the ice
Many species of seals and penguins rely on sea ice, especially for breeding and moulting.
Entire colonies of emperor penguins experienced “catastrophic breeding failure” in 2022, when sea ice melted before chicks were ready to go to sea.
After giving birth, crabeater seals need large, stable sea ice platforms for 2–3 weeks until their pups are weaned. The ice provides shelter and protection from predators. Less summer sea-ice cover makes large platforms harder to find.
Many seal and penguin species also take refuge on the sea ice when moulting. These species must avoid the icy water while their new feathers or fur grows, or risk dying of hypothermia.
4. Logistical challenges at the end of the world
Low summer sea ice makes it harder for people working in Antarctica. Shrinking summer sea ice will narrow the time window during which Antarctic bases can be resupplied over the ice. These bases may soon need to be resupplied from different locations, or using more difficult methods such as small boats.
Supply ships typically unload their cargo directly onto the sea ice, but that may have to change. Jared McGhie, Australian Antarctic Division
No longer safe
Anarctic sea ice began to change rapidly in 2015 and 2016. Since then it has remained well below the long-term average.
The dataset we use relies on measurements from US Department of Defense satellites. Late last month, the department announced it would no longer provide this data to the scientific community. While this has since been delayed to July 31, significant uncertainty remains.
One of the biggest challenges in climate science is gathering and maintaining consistent long-term datasets. Without these, we don’t accurately know how much our climate is changing. Observing the entire Earth is hard enough when we all work together. It’s going to be almost impossible if we don’t share our data.
Antarctic sea ice extent anomalies (the difference between the long-term average and the measurement) for the entire satellite record since the late 1970s. Edward Doddridge, using data from the US NSIDC Sea Ice Index, version 3., CC BY
Recent low sea ice summers present a scientific challenge. The system is currently changing faster than our scientific community can study it.
But vanishing sea ice also presents a challenge to society. The only way to prevent even more drastic changes in the future is to rapidly transition away from fossil fuels and reach net zero emissions.
How do you measure climate change? One way is by recording temperatures in different places over a long period of time. While this works well, natural variation can make it harder to see longer-term trends.
But another approach can give us a very clear sense of what’s going on: track how much heat enters Earth’s atmosphere and how much heat leaves. This is Earth’s energy budget, and it’s now well and truly out of balance.
Our recent research found this imbalance has more than doubled over the last 20 years. Other researchers have come to the same conclusions. This imbalance is now substantially more than climate models have suggested.
In the mid-2000s, the energy imbalance was about 0.6 watts per square metre (W/m2) on average. In recent years, the average was about 1.3 W/m2. This means the rate at which energy is accumulating near the planet’s surface has doubled.
These findings suggest climate change might well accelerate in the coming years. Worse still, this worrying imbalance is emerging even as funding uncertainty in the United States threatens our ability to track the flows of heat.
Energy in, energy out
Earth’s energy budget functions a bit like your bank account, where money comes in and money goes out. If you reduce your spending, you’ll build up cash in your account. Here, energy is the currency.
Life on Earth depends on a balance between heat coming in from the Sun and heat leaving. This balance is tipping to one side.
Solar energy hits Earth and warms it. The atmosphere’s heat-trapping greenhouse gases keep some of this energy.
But the burning of coal, oil and gas has now added more than two trillion tonnes of carbon dioxide and other greenhouse gases to the atmosphere. These trap more and more heat, preventing it from leaving.
Some of this extra heat is warming the land or melting sea ice, glaciers and ice sheets. But this is a tiny fraction. Fully 90% has gone into the oceans due to their huge heat capacity.
Earth naturally sheds heat in several ways. One way is by reflecting incoming heat off of clouds, snow and ice and back out to space. Infrared radiation is also emitted back to space.
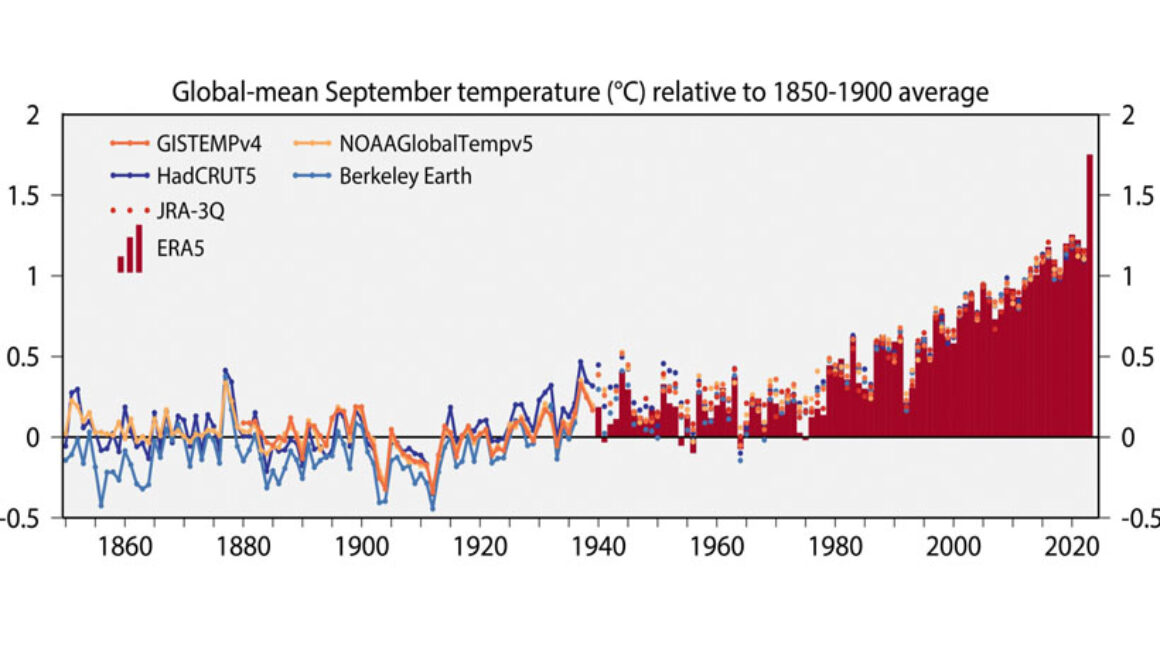
From the beginning of human civilisation up until just a century ago, the average surface temperature was about 14°C. The accumulating energy imbalance has now pushed average temperatures 1.3-1.5°C higher.
Ice and reflective clouds reflect heat back to space. As the Earth heats up, most trapped heat goes into the oceans but some melts ice and heats the land and air. Pictured: Icebergs from the Jacobshavn glacier in Greenland, the largest outside Antarctica. Photo: Cody Whitelaw
Tracking faster than the models
Scientists keep track of the energy budget in two ways.
First, we can directly measure the heat coming from the Sun and going back out to space, using the sensitive radiometers on monitoring satellites. This dataset and its predecessors date back to the late 1980s.
Second, we can accurately track the build-up of heat in the oceans and atmosphere by taking temperature readings. Thousands of robotic floats have monitored temperatures in the world’s oceans since the 1990s.
Both methods show the energy imbalance has grown rapidly.
The doubling of the energy imbalance has come as a shock, because the sophisticated climate models we use largely didn’t predict such a large and rapid change.
Typically, the models forecast less than half of the change we’re seeing in the real world.
Why has it changed so fast?
We don’t yet have a full explanation. But new research suggests changes in clouds is a big factor.
Clouds have a cooling effect overall. But the area covered by highly reflective white clouds has shrunk, while the area of jumbled, less reflective clouds has grown.
It isn’t clear why the clouds are changing. One possible factor could be the consequences of successful efforts to reduce sulfur in shipping fuel from 2020, as burning the dirtier fuel may have had a brightening effect on clouds. However, the accelerating energy budget imbalance began before this change.
Natural fluctuations in the climate system such as the Pacific Decadal Oscillation might also be playing a role. Finally – and most worryingly – the cloud changes might be part of a trend caused by global warming itself, that is, a positive feedback on climate change.
Dense blankets of white clouds reflect the most heat. But the area covered by these clouds is shrinking. Image: Vladimir Anikeev | Unsplash.
What does this mean?
These findings suggest recent extremely hot years are not one-offs but may reflect a strengthening of warming over the coming decade or longer.
This will mean a higher chance of more intense climate impacts from searing heatwaves, droughts and extreme rains on land, and more intense and long lasting marine heatwaves.
This imbalance may lead to worse longer-term consequences. New research shows the only climate models coming close to simulating real world measurements are those with a higher “climate sensitivity”. That means these models predict more severe warming beyond the next few decades in scenarios where emissions are not rapidly reduced.
We don’t know yet whether other factors are at play, however. It’s still too early to definitively say we are on a high-sensitivity trajectory.
Our eyes in the sky
We’ve known the solution for a long time: stop the routine burning of fossil fuels and phase out human activities causing emissions such as deforestation.
Keeping accurate records over long periods of time is essential if we are to spot unexpected changes.
Satellites, in particular, are our advance warning system, telling us about heat storage changes roughly a decade before other methods.
But funding cuts and drastic priority shifts in the United States may threaten essential satellite climate monitoring.
The ocean around Antarctica is rapidly getting saltier at the same time as sea ice is retreating at a record pace. Since 2015, the frozen continent has lost sea ice similar to the size of Greenland. That ice hasn’t returned, marking the largest global environmental change during the past decade.
This finding caught us off guard – melting ice typically makes the ocean fresher. But new satellite data shows the opposite is happening, and that’s a big problem. Saltier water at the ocean surface behaves differently than fresher seawater by drawing up heat from the deep ocean and making it harder for sea ice to regrow.
The loss of Antarctic sea ice has global consequences. Less sea ice means less habitat for penguins and other ice-dwelling species. More of the heat stored in the ocean is released into the atmosphere when ice melts, increasing the number and intensity of storms and accelerating global warming. This brings heatwaves on land and melts even more of the Antarctic ice sheet, which raises sea levels globally.
Our new study has revealed that the Southern Ocean is changing, but in a different way to what we expected. We may have passed a tipping point and entered a new state defined by persistent sea ice decline, sustained by a newly discovered feedback loop.
The Southern Ocean surrounds Antarctica, which is fringed by sea ice. Image: NASA
A surprising discovery
Monitoring the Southern Ocean is no small task. It’s one of the most remote and stormy places on Earth, and is covered in darkness for several months a year. Thanks to new European Space Agency satellites and underwater robots which stay below the ocean surface measuring temperature and salinity, we can now observe what is happening in real time.
Our team at the University of Southampton worked with colleagues at the Barcelona Expert Centre and the European Space Agency to develop new algorithms to track ocean surface conditions in polar regions from satellites. By combining satellite observations with data from underwater robots, we built a 15-year picture of changes in ocean salinity, temperature and sea ice.
What we found was astonishing. Around 2015, surface salinity in the Southern Ocean began rising sharply – just as sea ice extent started to crash. This reversal was completely unexpected. For decades, the surface had been getting fresher and colder, helping sea ice expand.
The annual summer minimum extent of Antarctic sea ice dropped precipitously in 2015. Image: NOAA Climate.gov/National Snow and Ice Data Center
To understand why this matters, it helps to think of the Southern Ocean as a series of layers. Normally, the cold, fresh surface water sits on top of warmer, saltier water deep below. This layering (or stratification, as scientists call it) traps heat in the ocean depths, keeping surface waters cool and helping sea ice to form.
Saltier water is denser and therefore heavier. So, when surface waters become saltier, they sink more readily, stirring the ocean’s layers and allowing heat from the deep to rise. This upward heat flux can melt sea ice from below, even during winter, making it harder for ice to reform. This vertical circulation also draws up more salt from deeper layers, reinforcing the cycle.
A powerful feedback loop is created: more salinity brings more heat to the surface, which melts more ice, which then allows more heat to be absorbed from the Sun. My colleagues and I saw these processes first hand in 2016-2017 with the return of the Maud Rise polynya, which is a gaping hole in the sea ice that is nearly four times the size of Wales and last appeared in the 1970s.
What happens in Antarctica doesn’t stay there
Losing Antarctic sea ice is a planetary problem. Sea ice acts like a giant mirror reflecting sunlight back into space. Without it, more energy stays in the Earth system, speeding up global warming, intensifying storms and driving sea level rise in coastal cities worldwide.
Wildlife also suffers. Emperor penguins rely on sea ice to breed and raise their chicks. Tiny krill – shrimp-like crustaceans which form the foundation of the Antarctic food chain as food for whales and seals – feed on algae that grow beneath the ice. Without that ice, entire ecosystems start to unravel.
What’s happening at the bottom of the world is rippling outward, reshaping weather systems, ocean currents and life on land and sea.
Feedback loops are accelerating the loss of Antarctic sea ice. Image: University of Southampton
Antarctica is no longer the stable, frozen continent we once believed it to be. It is changing rapidly, and in ways that current climate models didn’t foresee. Until recently, those models assumed a warming world would increase precipitation and ice-melting, freshening surface waters and helping keep Antarctic sea ice relatively stable. That assumption no longer holds.
Our findings show that the salinity of surface water is rising, the ocean’s layered structure is breaking down and sea ice is declining faster than expected. If we don’t update our scientific models, we risk being caught off guard by changes we could have prepared for. Indeed, the ultimate driver of the 2015 salinity increase remains uncertain, underscoring the need for scientists to revise their perspective on the Antarctic system and highlighting the urgency of further research.
We need to keep watching, yet ongoing satellite and ocean monitoring is threatened by funding cuts. This research offers us an early warning signal, a planetary thermometer and a strategic tool for tracking a rapidly shifting climate. Without accurate, continuous data, it will be impossible to adapt to the changes in store.
A NIWA-led study has found New Zealand’s native forests are absorbing more carbon dioxide (CO2) than previously thought.
Study leader, NIWA atmospheric scientist Dr Beata Bukosa, says the findings could have implications for New Zealand’s greenhouse gas reporting, carbon credit costs, and climate and land-use policies.
She says forests – both native and exotic – play a vital role in absorbing CO₂ through photosynthesis, but previous studies may have underestimated the amount of carbon taken up by New Zealand’s mature indigenous forests, which were thought to be roughly carbon neutral.
Using advanced modelling and NIWA’s supercomputer, the researchers examined a decade of atmospheric data, from 2011 to 2020, to better estimate the amount of CO₂ absorbed by New Zealand’s land ecosystems. The NIWA team worked with collaborators at GNS Science and Manaaki Whenua as well as other New Zealand and overseas universities and institutes.
The team used an inverse modelling technique – this combines atmospheric greenhouse gases with a model showing how air is transported through the atmosphere to identify CO2 sources and sinks – and compared the results against New Zealand’s Greenhouse Gas Inventory as well as ‘bottom-up’ models. While the Inventory applies a combination of field inventory, modelling, and remote sensing to quantify forest carbon stocks and stock changes, the ‘bottom-up’ models use calculations based on ecosystem processes, land use and climate across the country, says Dr Bukosa.
“It was thought that some areas and land use types were in a near-balance state with the absorption and release of CO₂. Earlier estimates of how much carbon was removed by New Zealand land ecosystems ranged from a net 24 to 118 million tonnes a year. Our research found that New Zealand’s natural environment absorbed approximately 171 million tonnes of CO₂ annually.” – Dr Bukosa
She says the largest differences between earlier estimates and the new findings came in the South Island.
“This was especially in areas dominated by mature native forests and certain grazing lands. We also found seasonal variation, as during autumn and winter, less CO₂ is released into the atmosphere than earlier estimates suggested.”
“That study was based on only three years of data, and we weren’t sure
if it was just a transient effect related to the climatic conditions, or
if the effect was confined to Fiordland. Our new study shows the carbon
sink is more widespread than we thought, particularly across the South
Island, with greater uptake of CO₂ extending up the West Coast.
“With improvements in our modelling techniques, and data coverage, we’ve
now shown the extra carbon uptake has persisted for at least a decade.
More research could help us understand exactly why our method has shown
such a difference in the carbon source and sink balance compared with
other methods.”
Inverse modelling provides an independent estimate of emissions that can complement inventory-based approaches for emissions reporting, she says.
“New Zealand was the first country to develop the capability to infer
national CO₂ emissions from atmospheric data and has since supported
other countries to develop similar capability.”
Dr Andrea Brandon, a Ministry for the Environment principal scientist who co-authored the study, said the findings help build a clearer picture of the role New Zealand’s natural systems play in absorbing emissions from the atmosphere. However, further work will be needed before they can be included in official emissions reporting.
“We continually improve the Inventory – New
Zealand’s annual record of emissions and removals – as new science and
evidence comes to light. This ensures we have robust information so that
we continue to meet our international reporting obligations.
“The findings from this study indicate there
may be additional carbon uptake somewhere in the system that we are
currently not tracking. We need to identify what we are missing so that
we can further refine our Inventory methods to capture it,” – Dr Andrea Brandon
Dr Bukosa says the results, due to be published shortly in the journal Atmospheric Chemistry and Physics and available here in preprint, have important implications for New Zealand’s tracking of carbon emissions and climate policies:
“We need to better understand why our native forests are absorbing more
CO₂ than expected, and what this could mean for our efforts to reduce
greenhouse gas emissions and achieve our domestic and international
targets.”
The research was part of a NIWA-led, MBIE-funded Endeavour programme called CarbonWatch NZ, which ended last year. NIWA principal scientist Dr Sara Mikaloff-Fletcher led CarbonWatch NZ and says the team is now looking to extend this work to definitively solve the puzzle of the difference in carbon between inventory methods and atmospheric measurements.
“This research suggests that we could make the most of opportunities to
slow climate change through changes to land management. Projections
suggest New Zealand will need 84 million tonnes of emissions reductions
on top of what can be done at home to meet its 2030 international
commitments under the Paris Agreement. In addition to reducing the need
for overseas offsets, better management of our native forests and other
lands could enable New Zealand to be long-term stewards of our carbon
sinks and offer magnificent biodiversity co-benefits.” – Dr
Mikaloff-Fletcher
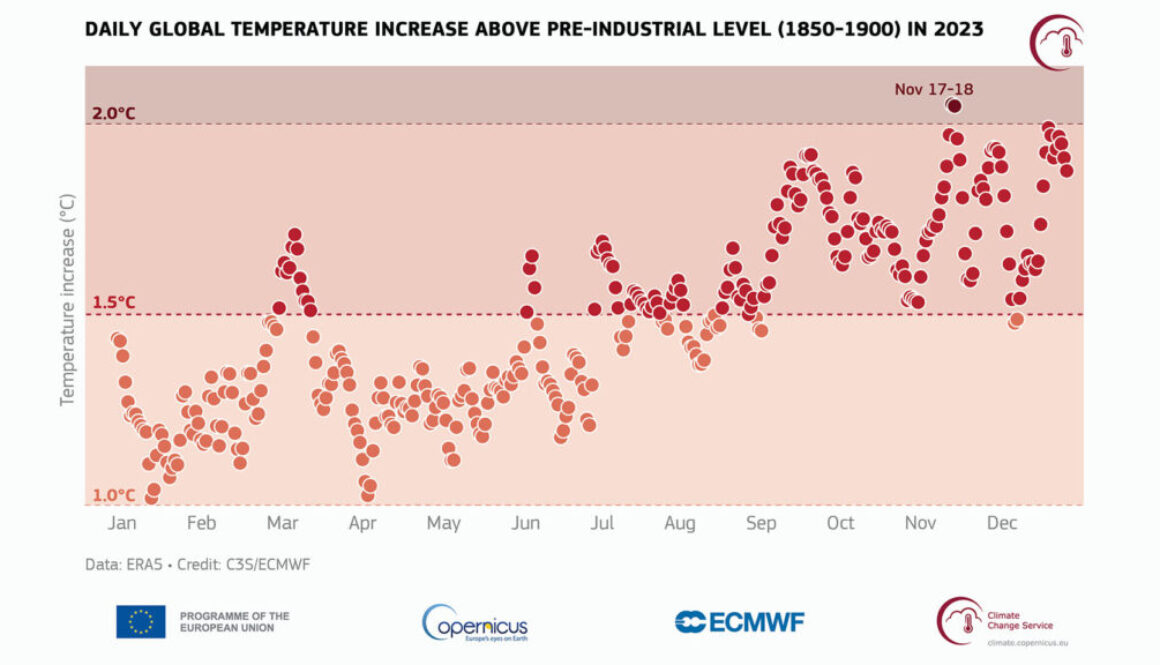
The 2015 Paris agreement committed countries to keeping the global temperature increase “well below 2°C”, which is widely interpreted as an average of 1.5°C over a 30-year period. The Paris agreement has not yet failed, but recent high temperatures show how close the Earth is to crossing this critical threshold.
Climate scientists have, using computer simulations, modelled pathways for halting climate change at internationally agreed limits. However, in recent years, many of the pathways that have been published involve exceeding 1.5°C for a few decades and removing enough greenhouse gas from the atmosphere to return Earth’s average temperature below the threshold again. Scientists call this “a temporary overshoot”.
If human activities were to raise the global average temperature 1.6°C above the pre-industrial average, for example, then CO₂ removal, using methods ranging from habitat restoration to mechanically capturing CO₂ from the air, would be required to return warming to below 1.5°C by 2100.
Do we really understand the consequences of “temporarily” overshooting 1.5°C? And would it even be possible to lower temperatures again?
Faith that a temporary overshoot will be safe and practicable has justified a deliberate strategy of delaying emission cuts in the short term, some scientists warn. The dangers posed by remaining above the 1.5°C limit for a period of time have received little attention by researchers like me, who study climate change.
To learn more, the UK government commissioned me and a team of 36 other scientists to examine the possible impacts.
How nature will be affected
We examined a “delayed action” scenario, in which greenhouse gas emissions remain similar for the next 15 years due to continued fossil fuel burning but then fall rapidly over a period of 20 years.
We projected that this would cause the rise in Earth’s temperature to peak at 1.9°C in 2060, before falling to 1.5°C in 2100 as greenhouse gases are removed from the atmosphere. We compared this scenario with a baseline scenario in which the global temperature does not exceed 1.5°C of warming this century.
Our Earth system model suggested that Arctic temperatures would be up to 4°C higher in 2060 compared to the baseline scenario. Arctic Sea ice loss would be much higher. Even after the global average temperature was returned to 1.5°C above pre-industrial levels, in 2100, the Arctic would remain around 1.5°C warmer compared to the baseline scenario. This suggests there are long-term and potentially irreversible consequences for the climate in overshooting 1.5°C.
As global warming approaches 2°C, warm-water corals, Arctic permafrost, Barents Sea ice and mountain glaciers could reach tipping points at which substantial and irreversible changes occur. Some scientists have concluded that the west Antarctic ice sheet may have already started melting irreversibly.
Our modelling showed that the risk of catastrophic wildfires is substantially higher during a temporary overshoot that culminates in 1.9°C of warming, particularly in regions already vulnerable to wildfires. Fires in California in early 2025 are an example of what is possible when the global temperature is higher.
Our analysis showed that the risk of species going extinct at 2°C of warming is double that at 1.5°C. Insects are most at risk because they are less able to move between regions in response to the changing climate than larger mammals and birds.
The impacts on society
Only armed conflict is considered by experts to have a greater impact on society than extreme weather. Forecasting how extreme weather will be affected by climate change is challenging. Scientists expect more intense storms, floods and droughts, but not necessarily in places that already regularly suffer these extremes.
In some places, moderate floods may reduce in size while larger, more extreme events occur more often and cause more damage. We are confident that the sea level would rise faster in a temporary overshoot scenario, and further increase the risk of flooding. We also expect more extreme floods and droughts, and for them to cause more damage to water and sanitation systems.
Floods and droughts will affect food production too. We found that impact studies have probably underestimated the crop damage that increases in extreme weather and water scarcity in key production areas during a temporary overshoot would cause.
We know that heatwaves become more frequent and intense as temperatures increase. More scarce food and water would increase the health risks of heat exposure beyond 1.5°C. It is particularly difficult to estimate the overall impact of overshooting this temperature limit when several impacts reinforce each other in this way.
In fact, most alarming of all is how uncertain much of our knowledge is.
For example, we have little confidence in estimates of how climate change will affect the economy. Some academics use models to predict how crops and other economic assets will be affected by climate change; others infer what will happen by projecting real-word economic losses to date into future warming scenarios. For 3°C of warming, estimates of the annual impact on GDP using models range from -5% to +3% each year, but up to -55% using the latter approach.
We have not managed to reconcile the differences between these methods. The highest estimates account for changes in extreme weather due to climate change, which are particularly difficult to determine.
We carried out an economic analysis using estimates of climate damage from both models and observed climate-related losses. We found that temporarily overshooting 1.5°C would reduce global GDP compared with not overshooting it, even if economic damages were lower than we expect. The economic consequences for the global economy could be profound.
So, what can we say for certain? First, that temporarily overshooting 1.5°C would be more costly to society and to the natural world than not overshooting it. Second, our projections are relatively conservative. It is likely that impacts would be worse, and possibly much worse, than we estimate.
Fundamentally, every increment of global temperature rise will worsen impacts on us and the rest of the natural world. We should aim to minimise global warming as much as possible, rather than focus on a particular target.
It would be hard to think of an industry less obviously “woke” than banking, but that’s how coalition partner NZ First has characterised certain practices within the finance sector.
Known as the “environmental, social and governance (ESG) framework”, such policies are designed to guide how a bank manages risks and opportunities beyond basic profit and loss.
NZ First’s bill seeks to ensure no New Zealand business can be denied banking services unless the decision is grounded in law. Its proponents argue it will prevent ESG standards from perpetuating “woke ideology” in the banking sector, driven by what they describe as “unelected, globalist, climate radicals”.
Prime Minister Christopher Luxon has supported the bill’s aims, recently calling it “utterly unacceptable” that petrol stations and mines were being denied banking services due to banks’ commitment to climate change goals.
Much of this is largely politically performative, however. A broader international trend has, for some time now, seen financial institutions increasingly aligning their lending practices with ESG criteria.
In Europe, for example, data from the European Banking Authority show banks have halved their exposures to mining firms since 2020, reflecting that global shift towards sustainability and risk management.
This is about more than “woke” agendas and is unlikely to reverse, given current global efforts to decarbonise. Encouraging or forcing banks to invest in carbon-emitting industries introduces financial risk. If those assets lose value, it constitutes irresponsible lending.
While the current US administration may be embracing fossil fuel industries, consumer and investor demand for sustainable policies is still strong. When banks such as the BNZ prepare for an orderly exit from declining industries, they are simply engaging in risk management.
Banks also manage regulatory risk. While the current government may enact the bill and force banks to invest in carbon-emitting industries, a future government could reverse that policy. This undermines long-term investment strategies.
Regulatory uncertainty
There is also a danger New Zealand is perceived internationally as not being serious about business and investment. In particular, the prime minister’s pressure on bank lending policies cuts across his stated commitment to the Paris Agreement on climate change.
The resulting regulatory uncertainty is counterproductive: it potentially deters international investors at a time when the government aims to attract foreign investment.
Ultimately, if bank lending policies lead to poor outcomes, it is ordinary New Zealanders who will likely bear the costs through higher interest rates or even bank failures.
In its eagerness to boost lending, the government is also encroaching on the Reserve Bank’s territory by directing it to prioritise competition, including reviewing risk weightings and capital thresholds (designed to build buffers against failure) for new entrants to the market.
But history shows that before the 2007-2009 global financial crisis, similar bank-friendly initiatives – often labelled “principles-based” – led to bad debt accumulation and increased economic vulnerability.
Institutional failure
The shift towards what we might call populist banking policies is not confined to New Zealand. Globally, there is a declining political interest in financial stability and prudential regulation.
For example, agreement on the “Basel III” reforms – developed in response to the global financial crisis and aimed at strengthening the regulation, supervision and risk management of banks – will likely be delayed by the Trump administration.
This will have ripple effects in Europe, Britain and the rest of the world, signalling a softening of global capital requirements. As Erik Thedéen, chair of the Basel Committee on Banking Supervision, described this:
Shaving off a few basis points of capital will not unlock a wave of new lending, but it will weaken your resilience. More generally, being well capitalised is a competitive advantage for banks and their shareholders. It ensures they can continue to grow and invest in profitable projects across the financial cycle.
Politicians need to be very careful when interfering with bank supervision policies in general. They risk undermining the independence of crucial institutions, with real consequences.
Last year’s Nobel Prize for economics went to Daron Acemoglu, Simon Johnson and James A. Robinson for their “studies of how institutions are formed and affect prosperity”. Their warning is that institutional failure can lead to the failure of nations.
A resilient banking system
While New Zealand isn’t in such imminent danger, political leaders need to be aware that populist appeals to certain voter segments can lead to policies that undermine the banking system and economic growth, and disproportionately affect the most vulnerable.
As Stelios Haji-Ioannou, founder of low-cost airline EasyJet, once remarked: “if you think safety is expensive, try an accident”.
New Zealand needs to focus on policies that promote long-term financial stability, enhance productivity and sustainable economic growth. Globally, there needs to be a recommitment to prudential regulation to ensure the lessons of the global financial crisis are not forgotten.
Only by doing so can we build a resilient banking system that serves the interests of all, not just a privileged few.
Top image: Government scientists at NOAA collect and provide crucial public information about coastal conditions that businesses, individuals and other scientists rely on.
NOAA’s National Ocean Service
This article is republished from The Conversation under a Creative Commons license. Read the original article. __________________________________________________________________________________
Information on the internet might seem like it’s there forever, but it’s only as permanent as people choose to make it.
That’s apparent as the second Trump administration “floods the zone” with efforts to dismantle science agencies and the data and websites they use to communicate with the public. The targets range from public health and demographics to climate science.
We are a research librarian and policy scholar who belong to a network called the Public Environmental Data Partners, a coalition of nonprofits, archivists and researchers who rely on federal data in our analysis, advocacy and litigation and are working to ensure that data remains available to the public.
In just the first three weeks of Trump’s term, we saw agencies remove access to at least a dozen climate and environmental justice analysis tools. The new administration also scrubbed the phrase “climate change” from government websites, as well as terms like “resilience.”
Here’s why and how Public Environmental Data Partners and others are making sure that the climate science the public depends on is available forever.
Why government websites and data matter
The internet and the availability of data are necessary for innovation, research and daily life.
If the data and tools used to understand complex data are abruptly taken off the internet, the work of scientists, civil society organizations and government officials themselves can grind to a halt. The generation of scientific data and analysis by government scientists is also crucial. Many state governments run environmental protection and public health programs that depend on science and data collected by federal agencies.
Removing information from government websites also makes it harder for the public to effectively participate in key processes of democracy, including changes to regulations. When an agency proposes to repeal a rule, for example, it is required to solicit comments from the public, who often depend on government websites to find information relevant to the rule.
And when web resources are altered or taken offline, it breeds mistrust in both government and science. Government agencies have collected climate data, conducted complex analyses, provided funding and hosted data in a publicly accessible manner for years. People around the word understand climate change in large part because of U.S. federal data. Removing it deprives everyone of important information about their world.
The second Trump administration seems different, with more rapid and pervasive removal of information.
In response, groups involved in Public Environmental Data Partners have been archiving climate datasets our community has prioritized, uploading copies to public repositories and cataloging where and how to find them if they go missing from government websites.
Most federal agencies decreased their use of the phrase ‘climate change’ on websites during the first Trump administration, 2017-2020.Eric Nost, et al., 2021, CC BY
As of Feb. 13, 2025, we hadn’t seen the destruction of climate science records. Many of these data collection programs, such as those at NOAA or EPA’s Greenhouse Gas Reporting Program, are required by Congress. However, the administration had limited or eliminated access to a lot of data.
Maintaining tools for understanding climate change
We’ve seen a targeted effort to systematically remove tools like dashboards that summarize and visualize the social dimensions of climate change. For instance, the Climate and Economic Justice Screening Tool mapped low-income and other marginalized communities that are expected to experience severe climate changes, such as crop losses and wildfires. The mapping tool was taken offline shortly after Trump’s first set of executive orders.
Most of the original data behind the mapping tool, like the wildfire risk predictions, is still available, but is now harder to find and access. But because the mapping tool was developed as an open-source project, we were able to recreate it.
Preserving websites for the future
In some cases, entire webpages are offline. For instance, the page for the 25-year-old Climate Change Center at the Department of Transportation doesn’t exist anymore. The link just sends visitors back to the department’s homepage.
During Donald Trump’s first week back in office, the Department of Transportation removed its Climate Change Center webpage.Internet Archive Wayback Machine
Fortunately, our partners at the End of Term Web Archive have captured snapshots of millions of government webpages and made them accessible through the Internet Archive’s Wayback Machine. The group has done this after each administration since 2008.
If you are worried that certain data currently still available might disappear, consult this checklist from MIT Libraries. It provides steps for how you can help safeguard federal data.
Narrowing the knowledge sphere
What’s unclear is how far the administration will push its attempts to remove, block or hide climate data and science, and how successful it will be.
Already, a federal district court judge has ruled that the Centers for Disease Control and Prevention’s removal of access to public health resources that doctors rely on was harmful and arbitrary. These were putback online thanks to that ruling.
We worry that more data and information removals will narrow public understanding of climate change, leaving people, communities and economies unprepared and at greater risk. While data archiving efforts can stem the tide of removals to some extent, there is no replacement for the government research infrastructures that produce and share climate data.
When people arrived on the shores of Aotearoa New Zealand and began to turn the land to their needs, they set in motion great changes.
The landscape of today bears little resemblance to that of a mere thousand years ago. More than 70% of forest cover has been lost since human arrival. Native bush has been replaced by tussocks, scrublands and, most of all, open agricultural land.
These changes affected our birdlife dramatically. Some species, like the moa, were simply hunted to extinction. Others fell directly to mammalian predators. Many species were victims of severe habitat destruction. The loss of suitable habitat remains a key conservation challenge to this day.
However, a changing distribution of plants is not a uniquely modern feature. New Zealand has seen equally radical shifts in habitat before – during the Ice Age, which lasted 2.6 million years and ended about 12,000 years ago.
This reconstruction shows the extend of glaciers during the height of the last Ice Age some 20,000 years ago.Shulmeister et al, 2019, CC BY-SA
At its height, parts of the country were up to 6°C colder than today, and glacial ice sheets spread wide fingers across the Southern Alps. The dry, cold climate resulted in widespread grass and scrubland. Forest cover became patchy everywhere except for the northern North Island.
Our new research tracks how bird life responded to these changes – in particular how exotic species took advantage of the shifting landscapes to make New Zealand home.
Ice Age invaders
Native birds responded to the Ice Age in a variety of ways. Kiwi populations became so isolated in forest patches they split into new lineages. Several moa species moved across the landscape, following their shifting habitat.
Some groups adapted, spreading into novel environments. Kea split off from their relatives the kākā, becoming more generalised. This is known as in situ adaptation; an existing group changing its habits or character to deal with new environments.
But where new ecological opportunities arise, species from elsewhere will also come to take advantage of them. Our research uncovers a pulse of colonisation by exotic bird species that coincides with the reduction of forest cover and the expansion of grasslands at the start of the Ice Age some 2.6 million years ago.
Many endemic New Zealand birds belong to young lineages that date back to landscape changes during the last Ice Age.Wikimedia Commons, Te Papa by Paul Martinson, CC BY-SA
These species were primarily generalists, able to take advantage of a variety of habitats. But there was also an influx of birds pre-adapted to more open conditions, such as the ancestors of Haast’s eagle, pūtangitangi (paradise shelduck) and pīhoihoi (pipit).
Where did these “invaders” come from? Principally, from Australia. For millions of years, they have ridden the winds across the Tasman Sea and, occasionally, established breeding colonies on our shores.
Over a long enough time, those new populations evolved to become distinct, endemic New Zealand species found nowhere else on earth. Pīwakawaka (fantail), ruru (morepork), weweia (dabchick) and kakī (black stilt), to name a few, are all descended from Ice Age Australian ancestors.
They arrived in a New Zealand characterised by scrub, tussock and grass during cold glacial periods, followed by slowly expanding forests during warmer interglacials.
History repeats itself
Today, open vistas once again dominate the landscape. This time they were sculpted by humans rather than a cooling climate. The changing environment means new ecological opportunities – and vacancies – have been left by the great number of species that have gone extinct.
The open landscapes of today mirror the impacts of the Ice Age. Forest cover is reduced, grass and scrub cover the North and South islands.Lubbe et al, 2025, CC BY-SA
Silvereyes have been here longer, first reported during the 1850s, while glossy ibis and barn owl only started breeding here this century. All likely flew across the Tasman to settle here.
Some arrivals seem to serve as ecological replacements of a kind. The kāhu (swamp harrier) is a stand-in for the now-extinct Eyles’ harrier and Haast’s eagle. The poaka (pied stilt) is a common sight where kakī once dominated. And Australian coots proliferate where New Zealand coots once waded.
Native habitats for native birds
These birds are following ancient patterns and processes. Where new opportunities appear, new organisms will rise to fill them. Our highly modified ecosystems are responding in the only way open to them, with exotic species expanding their range to take advantage of empty ecological niches – job vacancies in the ecosystem.
Indeed, these invasions are likely to become more frequent as species distributions shift in a warming climate. As our native species decline under threats of habitat loss and predation by mammalian pests, they will be ecologically replaced by other species.
Left to their own devices, Aotearoa’s plants and animals will look different in the future. The unique species that have called these islands home for millions of years will increasingly be replaced by more generalist species from elsewhere.
The route to protecting our native species in a fast changing world remains as clear as ever – protect and restore native habitat and eradicate mammalian predators.
Observing Greenland from a helicopter, the main problem is one of comprehending scale. I have thought we were skimming low over the waves of a fjord, before noticing the tiny shadow of a seabird far below and realising what I suspected were floating shards of ice were in fact icebergs the size of office blocks. I have thought we were hovering high in the sky over a featureless icy plane below, before bumping down gently onto ice only a few metres below us.
Crevasses – cracks in the surface of glaciers – are the epitome of this baffling range of scales. Formed by stresses at the surface, their direction and size tell us how the ice sheet is flowing towards the ocean. Inland, far away from the fast-flowing glaciers that discharge hundreds of gigatonnes of icebergs a year into fjords, crevasses can be tiny cracks only millimetres wide.
As the ice speeds up, they can be metres in diameter, sometimes covered by deceptive snow bridges that require suitable safety equipment and rescue training to traverse. Finally, where the ice meets the ocean and no scientist would ever dare to stand, they can be monsters over 100 metres from wall to wall. And across Greenland, they are growing.
Cracks you could fly a helicopter through.Tom Chudley
It shouldn’t be particularly surprising to scientists that crevasses are getting larger across Greenland. As the ocean warms, the ice sheet has sped up in response, increasing the stresses acting upon its surface. However, observations from satellites and in-person fieldwork are so poor that to date, we had no idea how extensively or quickly this process has been occurring.
Mapping cracks
In a new study, my colleagues and I mapped crevasses across the entirety of the Greenland ice sheet in 2016 and 2021. To do this, we used the “ArcticDEM”: three-dimensional surface maps of the polar regions based on high resolution satellite images. By applying image-processing techniques to over 8,000 maps, we could estimate how much water, snow or air would be needed to “fill” each crevasse across the ice sheet. This enabled us to calculate their depth and volume, and examine how they evolved.
We found that from 2016 to 2021, there were significant increases in crevasse volume across fast-flowing sectors of the Greenland ice sheet. In the southeast of the ice sheet, an area that has been particularly vulnerable to ocean-induced acceleration and retreat in the past few years, crevasse volume increased by over 25%.
In most Greenland glaciers that flow into the ocean, scientists found crevasses are increasing in size and depth.Chudley et al / Nature Geoscience
However, against our expectations, crevasse volume across the whole ice sheet increased by only 4.3%. That’s much closer to an overall balance than the extremes observed in certain sectors. What had happened? In fact, the significant increases elsewhere were being offset by a single source: an outlet glacier known as Sermeq Kujalleq (Danish: Jakobshavn Isbræ).
Sermeq Kujalleq is the fastest-flowing glacier on the planet, reaching speeds of nearly 50 metres a day and providing an outsized proportion of Greenland’s total sea-level rise contribution. In 2016, responding to an influx of cold water from the north Atlantic ocean, the glacier slowed and thickened. As it did this, the crevasses on the surface began to close – offsetting increases across the rest of the ice sheet.
This slowdown was short-lived. Since 2018, Sermeq Kujalleq has once again reverted to acceleration and thinning in response to ongoing warming. We won’t be able to rely on it to offset ice-sheet-wide increases in crevassing in the future.
Cracks grow into icebergs
Crevasses play an integral part in the life cycle of glaciers, and as they grow they hold the potential to further accelerate ice-sheet loss. They deliver surface meltwater into the belly of the ice sheet: once inside, water can act to warm the ice or lubricate the bed that the glacier slides over, both of which can make the ice sheet flow faster into the ocean. Meanwhile, where the ice meets the sea, crevasses form the initial fractures from which icebergs can break off, increasing the output of icebergs into the ocean.
Where Sermeq Kujalleq, or Jakobshavn Glacier, meets the sea. That iceberg filled fjord is several miles wide.Copernicus Sentinel / lavizzara / shutterstock
In short, crevasses underpin the dynamic processes that occur across Greenland and Antarctica. However, these processes are very poorly understood, and their future evolution is the single largest uncertainty in our predictions of sea-level rise. Together, the increased discharge of ice holds the potential to add up to 10 metres of additional sea-level rise by 2300 (75% of all cities with more than 5 million inhabitants exist less than 10m above sea level). We need to better understand these processes – including crevasses – so that informed sea-level projections can form the basis of our responses to the global challenges that climate change presents.
Since 2023, an international coalition of polar scientists has been urging the world to limit warming to 1.5˚C to avoid the most catastrophic melt scenarios for global glaciers and ice sheets. Last month, the EU’s Copernicus Climate Change Service confirmed that 2024 was the first year in which average global temperatures exceeded this threshold.
Every fraction of a degree matters. We may still be able to save ourselves from the worst of the damage the climate change will bring – but we are desperately running out of time.