effects

Podcast hosted by: Joelle Gergis, Australian National University and Michael Green, The Conversation
Interviewed: Honorary Professor, The University of Melbourne; Senior Lecturer in Climate Science, Imperial College London, Physics Professor, University of the West Indies, Mona Campus
This article is republished from The Conversation under a Creative Commons license. Read the original article.
But when an extreme weather event hits, how certain can we be that it was made more likely by climate change? How do we know it wasn’t just a rare, naturally-occuring event that might have happened anyway?
Fear & Wonder is a new podcast from The Conversation that takes you inside the UN’s era-defining climate report via the hearts and minds of the scientists who wrote it.
The show is hosted by Dr Joëlle Gergis – a climate scientist and IPCC lead author – and award-winning journalist Michael Green.
In this episode, we’re delving into one of the major shifts in the public communication of climate change – the attribution of extreme weather events to climate change.
Although in the past we knew climate change was making extreme weather more likely, advances in climate modelling now allow scientists to pinpoint the influence of natural and human-caused factors on individual weather extremes.
We speak to climatologist Dr Friederike Otto about a rapid attribution study of a heatwave in Toulouse, France, as it unfolded in 2019. We also hear from climatologist Professor David Karoly to help us understand how climate models actually work, while Professor Tannecia Stephenson explains how global models are then used to develop regional climate change projections over the Caribbean island of Jamaica.
To listen and subscribe, click here, or click the icon for your favourite podcast app in the graphic above.
Fear and Wonder is sponsored by the Climate Council, an independent, evidence-based organisation working on climate science, impacts and solutions.![]()
By: Edward Doddridge, Research Associate in Physical Oceanography, University of Tasmania
This article is republished from The Conversation under a Creative Commons license. Read the original article.
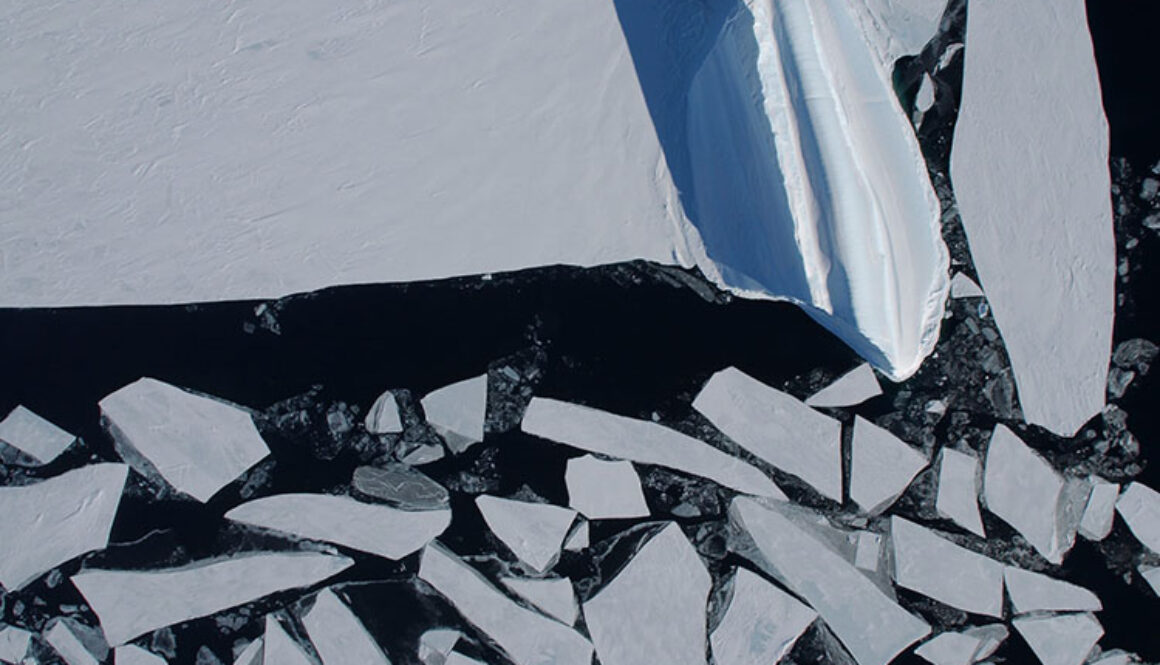
The rhythmic expansion and contraction of Antarctic sea ice is like a heartbeat.
But lately, there’s been a skip in the beat. During each of the last two summers, the ice around Antarctica has retreated farther than ever before.
And just as a change in our heartbeat affects our whole body, a change to sea ice around Antarctica affects the whole world.
Today, researchers at the Australian Antarctic Program Partnership (AAPP) and the Australian Centre for Excellence in Antarctic Science (ACEAS) have joined forces to release a science briefing for policy makers, On Thin Ice.
Together we call for rapid cuts to greenhouse gas emissions, to slow the rate of global heating. We also need to step up research in the field, to get a grip on sea-ice science before it’s too late.
The shrinking white cap on our blue planet
One of the largest seasonal cycles on Earth happens in the ocean around Antarctica. During autumn and winter the surface of the ocean freezes as sea ice advances northwards, and then in the spring the ice melts as the sunlight returns.
We’ve been able to measure sea ice from satellites since the late 1970s. In that time we’ve seen a regular cycle of freezing and melting. At the winter maximum, sea ice covers an area more than twice the size of Australia (roughly 20 million square kilometres), and during summer it retreats to cover less than a fifth of that area (about 3 million square km).
In 2022 the summer minimum was less than 2 million square km for the first time since satellite records began. This summer, the minimum was even lower – just 1.7 million square km.
The annual freeze pumps cold salty water down into the deep ocean abyss. The water then flows northwards. About 40% of the global ocean can be traced back to the Antarctic coastline.
By exchanging water between the surface ocean and the abyss, sea ice formation helps to sequester heat and carbon dioxide in the deep ocean. It also helps to bring long-lost nutrients back up to the surface, supporting ocean life around the world.
Not only does sea ice play a crucial role in pumping seawater across the planet, it insulates the ocean underneath. During the long days of the Antarctic summer, sunlight usually hits the bright white surface of the sea ice and is reflected back into space.
This year, there is less sea ice than normal and so the ocean, which is dark by comparison, is absorbing much more solar energy than normal. This will accelerate ocean warming and will likely impede the wintertime growth of sea ice.
Headed for stormy seas
The Southern Ocean is a stormy place; the epithets “Roaring Forties” and “Furious Fifties” are well deserved. When there is less ice, the coastline is more exposed to storms. Waves pound on coastlines and ice shelves that are normally sheltered behind a broad expanse of sea ice. This battering can lead to the collapse of ice shelves and an increase in the rate of sea level rise as ice sheets slide off the land into the ocean more rapidly.
Sea ice supports many levels of the food web. When sea ice melts it releases iron, which promotes phytoplankton growth. In the spring we see phytoplankton blooms that follow the retreating sea ice edge. If less ice forms, there will be less iron released in the spring, and less phytoplankton growth.
Krill, the small crustaceans that provide food to whales, seals, and penguins, need sea ice. Many larger species such as penguins and seals rely on sea ice to breed. The impact of changes to the sea ice on these larger animals varies dramatically between species, but they are all intimately tied to the rhythm of ice formation and melt. Changes to the sea-ice heartbeat will disrupt the finely balanced ecosystems of the Southern Ocean.

A diagnosis for policy makers
Long term measurements show the subsurface Southern Ocean is getting warmer. This warming is caused by our greenhouse gas emissions. We don’t yet know if this ocean warming directly caused the record lows seen in recent summers, but it is a likely culprit.
As scientists in Australia and around the world work to understand these recent events, new evidence will come to light for a clearer understanding of what is causing the sea ice around Antarctica to melt.

Antarctic sea ice is highly variable, but there has been less ice than normal for almost all of the last seven years. This chart of monthly sea ice extent anomaly shows the difference between the long-term average sea ice and the observed sea ice in each month. By removing the annual cycle due to sea ice formation and melt, we can see the longer term variability underneath, and the extreme low sea ice events in recent years. Dr Phil Reid, BoM, Author provided
If you noticed a change in your heartbeat, you’d likely see a doctor. Just as doctors run tests and gather information, climate scientists undertake fieldwork, gather observations, and run simulations to better understand the health of our planet.
This crucial work requires specialised icebreakers with sophisticated observational equipment, powerful computers, and high-tech satellites. International cooperation, data sharing, and government support are the only ways to provide the resources required.
After noticing the first signs of heart trouble, a doctor might recommend more exercise or switching to a low-fat diet. Maintaining the health of our planet requires the same sort of intervention – we must rapidly cut our consumption of fossil fuels and improve our scientific capabilities.
By: Christine Batchelor, Lecturer in Physical Geography, Newcastle University and Frazer Christie, Postdoctoral Research Associate, University of Cambridge
This article is republished from The Conversation under a Creative Commons license. Read the original article.
The Antarctic Ice Sheet, which covers an area greater than the US and Mexico combined, holds enough water to raise global sea level by more than 57 metres if melted completely. This would flood hundreds of cities worldwide. And evidence suggests it is melting fast. Satellite observations have revealed that grounded ice (ice that is in contact with the bed beneath it) in coastal areas of West Antarctica has been lost at a rate of up to 30 metres per day in recent years.
But the satellite record of ice sheet change is relatively short as there are only 50 years’ worth of observations. This limits our understanding of how ice sheets have evolved over longer periods of time, including the maximum speed at which they can retreat and the parts that are most vulnerable to melting.
So, we set out to investigate how ice sheets responded during a previous period of climatic warming – the last “deglaciation”. This climate shift occurred between roughly 20,000 and 11,000 years ago and spanned Earth’s transition from a glacial period, when ice sheets covered large parts of Europe and North America, to the period in which we currently live (called the Holocene interglacial period).
During the last deglaciation, rates of temperature and sea-level rise were broadly comparable to today. So, studying the changes to ice sheets in this period has allowed us to estimate how Earth’s two remaining ice sheets (Greenland and Antarctica) might respond to an even warmer climate in the future.
Our recently published results show that ice sheets are capable of retreating in bursts of up to 600 metres per day. This is much faster than has been observed so far from space.
Pulses of rapid retreat
Our research used high-resolution maps of the Norwegian seafloor to identify small landforms called “corrugation ridges”. These 1–2 metre high ridges were produced when a former ice sheet retreated during the last deglaciation.
Tides lifted the ice sheet up and down. At low tide, the ice sheet rested on the seafloor, which pushed the sediment at the edge of the ice sheet upwards into ridges. Given that there are two low tides each day off Norway, two separate ridges were produced daily. Measuring the space between these ridges enabled us to calculate the pace of the ice sheet’s retreat.
During the last deglaciation, the Scandinavian Ice Sheet that we studied underwent pulses of extremely rapid retreat – at rates between 50 and 600 metres per day. These rates are up to 20 times faster than the highest rate of ice sheet retreat that has so far been measured in Antarctica from satellites.
The highest rates of ice sheet retreat occurred across the flattest areas of the ice sheet’s bed. In flat-bedded areas, only a relatively small amount of melting, of around half a metre per day, is required to instigate a pulse of rapid retreat. Ice sheets in these regions are very lightly attached to their beds and therefore require only minimal amounts of melting to become fully buoyant, which can result in almost instantaneous retreat.
However, rapid “buoyancy-driven” retreat such as this is probably only sustained over short periods of time – from days to months – before a change in the ice sheet bed or ice surface slope farther inland puts the brakes on retreat. This demonstrates how nonlinear, or “pulsed”, the nature of ice sheet retreat was in the past.
This will likely also be the case in the future.
A warning from the past
Our findings reveal how quickly ice sheets are capable of retreating during periods of climate warming. We suggest that pulses of very rapid retreat, from tens to hundreds of metres per day, could take place across flat-bedded parts of the Antarctic Ice Sheet even under current rates of melting.
This has implications for the vast and potentially unstable Thwaites Glacier of West Antarctica. Since scientists began observing ice sheet changes via satellites, Thwaites Glacier has experienced considerable retreat and is now only 4km away from a flat area of its bed. Thwaites Glacier could therefore suffer pulses of rapid retreat in the near future.
Ice losses resulting from retreat across this flat region could accelerate the rate at which ice in the rest of the Thwaites drainage basin collapses into the ocean. The Thwaites drainage basin contains enough ice to raise global sea levels by approximately 65cm.

Our results shed new light on how ice sheets interact with their beds over different timescales. High rates of retreat can occur over decades to centuries where the bed of an ice sheet deepens inland. But we found that ice sheets on flat regions are most vulnerable to extremely rapid retreat over much shorter timescales.
Together with data about the shape of ice sheet beds, incorporating this short-term mechanism of retreat into computer simulations will be critical for accurately predicting rates of ice sheet change and sea-level rise in the future.
By: Matthew England, Scientia Professor and Deputy Director of the ARC Australian Centre for Excellence in Antarctic Science (ACEAS), UNSW Sydney; Adele Morrison Research Fellow, Australian National University; Andy Hogg Professor, Australian National University; Qian Li Massachusetts Institute of Technology (MIT); Steve Rintoul CSIRO Fellow, CSIRO.
Republished in full from The Conversation under a Creative Commons license. See the original article: March 3, 2023
Off the coast of Antarctica, trillions of tonnes of cold salty water sink to great depths. As the water sinks, it drives the deepest flows of the “overturning” circulation – a network of strong currents spanning the world’s oceans. The overturning circulation carries heat, carbon, oxygen and nutrients around the globe, and fundamentally influences climate, sea level and the productivity of marine ecosystems.
But there are worrying signs these currents are slowing down. They may even collapse. If this happens, it would deprive the deep ocean of oxygen, limit the return of nutrients back to the sea surface, and potentially cause further melt back of ice as water near the ice shelves warms in response. There would be major global ramifications for ocean ecosystems, climate, and sea-level rise.
Our new research, published today in the journal Nature, uses new ocean model projections to look at changes in the deep ocean out to the year 2050. Our projections show a slowing of the Antarctic overturning circulation and deep ocean warming over the next few decades. Physical measurements confirm these changes are already well underway.
Climate change is to blame. As Antarctica melts, more freshwater flows into the oceans. This disrupts the sinking of cold, salty, oxygen-rich water to the bottom of the ocean. From there this water normally spreads northwards to ventilate the far reaches of the deep Indian, Pacific and Atlantic Oceans. But that could all come to an end soon. In our lifetimes.
Why does this matter?
As part of this overturning, about 250 trillion tonnes of icy cold Antarctic surface water sinks to the ocean abyss each year. The sinking near Antarctica is balanced by upwelling at other latitudes. The resulting overturning circulation carries oxygen to the deep ocean and eventually returns nutrients to the sea surface, where they are available to support marine life.
If the Antarctic overturning slows down, nutrient-rich seawater will build up on the seafloor, five kilometres below the surface. These nutrients will be lost to marine ecosystems at or near the surface, damaging fisheries.
Changes in the overturning circulation could also mean more heat gets to the ice, particularly around West Antarctica, the area with the greatest rate of ice mass loss over the past few decades. This would accelerate global sea-level rise.
An overturning slowdown would also reduce the ocean’s ability to take up carbon dioxide, leaving more greenhouse gas emissions in the atmosphere. And more greenhouse gases means more warming, making matters worse.
Meltwater-induced weakening of the Antarctic overturning circulation could also shift tropical rainfall bands around a thousand kilometres to the north.
Put simply, a slowing or collapse of the overturning circulation would change our climate and marine environment in profound and potentially irreversible ways.
Signs of worrying change
The remote reaches of the oceans that surround Antarctica are some of the toughest regions to plan and undertake field campaigns. Voyages are long, weather can be brutal, and sea ice limits access for much of the year.
This means there are few measurements to track how the Antarctic margin is changing. But where sufficient data exist, we can see clear signs of increased transport of warm waters toward Antarctica, which in turn causes ice melt at key locations.
Indeed, the signs of melting around the edges of Antarctica are very clear, with increasingly large volumes of freshwater flowing into the ocean and making nearby waters less salty and therefore less dense. And that’s all that’s needed to slow the overturning circulation. Denser water sinks, lighter water does not.
How did we find this out?
Apart from sparse measurements, incomplete models have limited our understanding of ocean circulation around Antarctica.
For example, the latest set of global coupled model projections analysed by the Intergovernmental Panel on Climate Change exhibit biases in the region. This limits the ability of these models in projecting the future fate of the Antarctic overturning circulation.
To explore future changes, we took a high resolution global ocean model that realistically represents the formation and sinking of dense water near Antarctica.
We ran three different experiments, one where conditions remained unchanged from the 1990s; a second forced by projected changes in temperature and wind; and a third run also including projected changes in meltwater from Antarctica and Greenland.
In this way we could separate the effects of changes in winds and warming, from changes due to ice melt.
The findings were striking. The model projects the overturning circulation around Antarctica will slow by more than 40% over the next three decades, driven almost entirely by pulses of meltwater.
Over the same period, our modelling also predicts a 20% weakening of the famous North Atlantic overturning circulation which keeps Europe’s climate mild. Both changes would dramatically reduce the renewal and overturning of the ocean interior.
We’ve long known the North Atlantic overturning currents are vulnerable, with observations suggesting a slowdown is already well underway, and projections of a tipping point coming soon. Our results suggest Antarctica looks poised to match its northern hemisphere counterpart – and then some.
What next?
Much of the abyssal ocean has warmed in recent decades, with the most rapid trends detected near Antarctica, in a pattern very similar to our model simulations.
Our projections extend out only to 2050. Beyond 2050, in the absence of strong emissions reductions, the climate will continue to warm and the ice sheets will continue to melt. If so, we anticipate the Southern Ocean overturning will continue to slow to the end of the century and beyond.
The projected slowdown of Antarctic overturning is a direct response to input of freshwater from melting ice. Meltwater flows are directly linked to how much the planet warms, which in turn depends on the greenhouse gases we emit.
Our study shows continuing ice melt will not only raise sea-levels, but also change the massive overturning circulation currents which can drive further ice melt and hence more sea level rise, and damage climate and ecosystems worldwide. It’s yet another reason to address the
climate crisis – and fast.
By: Professor of Energy and Climate Change, University of Manchester. Republished in full from The Conversation under a Creative Commons license. See the original article: March 25, 2023
The Intergovernmental Panel on Climate Change’s (IPCC) synthesis report recently landed with an authoritative thump, giving voice to hundreds of scientists endeavouring to understand the unfolding calamity of global heating. What’s changed since the last one in 2014? Well, we’ve dumped an additional third of a trillion tonnes of CO₂ into the atmosphere, primarily from burning fossil fuels. While world leaders promised to cut global emissions, they have presided over a 5% rise.
The new report evokes a mild sense of urgency, calling on governments to mobilise finance to accelerate the uptake of green technology. But its conclusions are far removed from a direct interpretation of the IPCC’s own carbon budgets (the total amount of CO₂ scientists estimate can be put into the atmosphere for a given temperature rise).
The report claims that, to maintain a 50:50 chance of warming not exceeding 1.5°C above pre-industrial levels, CO₂ emissions must be cut to “net-zero” by the “early 2050s”. Yet, updating the IPCC’s estimate of the 1.5°C carbon budget, from 2020 to 2023, and then drawing a straight line down from today’s total emissions to the point where all carbon emissions must cease, and without exceeding this budget, gives a zero CO₂ date of 2040.
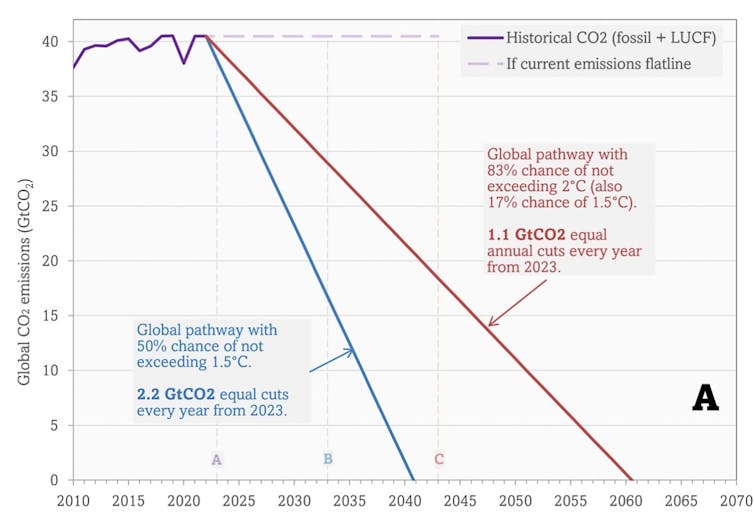
Given it will take a few years to organise the necessary political structures and technical deployment, the date for eliminating all CO₂ emissions to remain within 1.5°C of warming comes closer still, to around the mid-2030s. This is a strikingly different level of urgency to that evoked by the IPCC’s “early 2050s”. Similar smoke and mirrors lie behind the “early 2070s” timeline the IPCC conjures for limiting global heating to 2°C.
IPCC science embeds colonial attitudes
For over two decades, the IPCC’s work on cutting emissions (what experts call “mitigation”) has been dominated by a particular group of modellers who use huge computer models to simulate what may happen to emissions under different assumptions, primarily related to price and technology. I’ve raised concerns before about how this select cadre, almost entirely based in wealthy, high-emitting nations, has undermined the necessary scale of emission reductions.
In 2023, I can no longer tiptoe around the sensibilities of those overseeing this bias. In my view, they have been as damaging to the agenda of cutting emissions as Exxon was in misleading the public about climate science. The IPCC’s mitigation report in 2022 did include a chapter on “demand, services and social aspects” as a repository for alternative voices, but these were reduced to an inaudible whisper in the latest report’s influential summary for policymakers.
The specialist modelling groups (referred to as Integrated Assessment Modelling, or IAMs) have successfully crowded out competing voices, reducing the task of mitigation to price-induced shifts in technology – some of the most important of which, like so-called “negative emissions technologies”, are barely out of the laboratory.
The IPCC offers many “scenarios” of future low-carbon energy systems and how we might get there from here. But as the work of academic Tejal Kanitkar and others has made clear, not only do these scenarios prefer speculative technology tomorrow over deeply challenging policies today (effectively a greenwashed business-as-usual), they also systematically embed colonial attitudes towards “developing nations”.
With few if any exceptions, they maintain current levels of inequality between developed and developing nations, with several scenarios actually increasing the levels of inequality. Granted, many IAM modellers strive to work objectively, but they do so within deeply subjective boundaries established and preserved by those leading such groups.
What happened to equity?
If we step outside the rarefied realm of IAM scenarios that leading climate scientist Johan Rockström describes as “academic gymnastics that have nothing to do with reality”, it’s clear that not exceeding 1.5°C or 2°C will require fundamental changes to most facets of modern life.
Starting now, to not exceed 1.5°C of warming requires 11% year-on-year cuts in emissions, falling to nearer 5% for 2°C. However, these global average rates ignore the core concept of equity, central to all UN climate negotiations, which gives “developing country parties” a little longer to decarbonise.
Include equity and most “developed” nations need to reach zero CO₂ emissions between 2030 and 2035, with developing nations following suit up to a decade later. Any delay will shrink these timelines still further.
Most IAM models ignore and often even exacerbate the obscene inequality in energy use and emissions, both within nations and between individuals. As the International Energy Agency recently reported, the top 10% of emitters accounted for nearly half of global CO₂ emissions from energy use in 2021, compared with 0.2% for the bottom 10%. More disturbingly, the greenhouse gas emissions of the top 1% are 1.5 times those of the bottom half of the world’s population.
So where does this leave us? In wealthier nations, any hope of arresting global heating at 1.5 or 2°C demands a technical revolution on the scale of the post-war Marshall Plan. Rather than relying on technologies such as direct air capture of CO₂ to mature in the near future, countries like the UK must rapidly deploy tried-and-tested technologies.
Retrofit housing stock, shift from mass ownership of combustion-engine cars to expanded zero-carbon public transport, electrify industries, build new homes to Passivhaus standard, roll-out a zero-carbon energy supply and, crucially, phase out fossil fuel production.
Three decades of complacency has meant technology on its own cannot now cut emissions fast enough. A second, accompanying phase, must be the rapid reduction of energy and material consumption.
Given deep inequalities, this, and deploying zero-carbon infrastructure, is only possible by re-allocating society’s productive capacity away from enabling the private luxury of a few and austerity for everyone else, and towards wider public prosperity and private sufficiency.
For most people, tackling climate change will bring multiple benefits, from affordable housing to secure employment. But for those few of us who have disproportionately benefited from the status quo, it means a profound reduction in how much energy we use and stuff we accumulate.
The question now is, will we high-consuming few make (voluntarily or by force) the fundamental changes needed for decarbonisation in a timely and organised manner? Or will we fight to maintain our privileges and let the rapidly changing climate do it, chaotically and brutally, for us?
Rainier, seasons shifting, with broad disturbances for people, ecosystems and wildlife
Reprinted with permission from The Conversation
Matthew L. Druckenmiller, University of Colorado Boulder; Rick Thoman, University of Alaska Fairbanks, and Twila Moon, University of Colorado Boulder
In the Arctic, the freedom to travel, hunt and make day-to-day decisions is profoundly tied to cold and frozen conditions for much of the year. These conditions are rapidly changing as the Arctic warms.
The Arctic is now seeing more rainfall when historically it would be snowing. Sea ice that once protected coastlines from erosion during fall storms is forming later. And thinner river and lake ice is making travel by snowmobile increasingly life-threatening.
Ship traffic in the Arctic is also increasing, bringing new risks to fragile ecosystems, and the Greenland ice sheet is continuing to send freshwater and ice into the ocean, raising global sea level
In the annual Arctic Report Card, released Dec. 13, 2022, we brought together 144 other Arctic scientists from 11 countries to examine the current state of the Arctic system.

Some of the Arctic headlines of 2022 discussed in the Arctic Report Card.
NOAA Climate.gov
The Arctic is getting wetter and rainier
We found that Arctic precipitation is on the rise across all seasons, and these seasons are shifting.
Much of this new precipitation is now falling as rain, sometimes during winter and traditionally frozen times of the year. This disrupts daily life for humans, wildlife and plants.
Roads become dangerously icy more often, and communities face greater risk of river flooding events. For Indigenous reindeer herding communities, winter rain can create an impenetrable ice layer that prevents their reindeer from accessing vegetation beneath the snow.

Arctic-wide, this shift toward wetter conditions can disrupt the lives of animals and plants that have evolved for dry and cold conditions, potentially altering Arctic peoples’ local foods.
When Fairbanks, Alaska, got 1.4 inches of freezing rain in December 2021, the moisture created an ice layer that persisted for months, bringing down trees and disrupting travel, infrastructure and the ability of some Arctic animals to forage for food. The resulting ice layer was largely responsible for the deaths of a third of a bison herd in interior Alaska.
There are multiple reasons for this increase in Arctic precipitation.
As sea ice rapidly declines, more open water is exposed, which feeds increased moisture into the atmosphere. The entire Arctic region has seen a more than 40% loss in summer sea ice extent over the 44-year satellite record.
The Arctic atmosphere is also warming more than twice as fast as the rest of the globe, and this warmer air can hold more moisture.

Under the ground, the wetter, rainier Arctic is accelerating the thaw of permafrost, upon which most Arctic communities and infrastructure are built. The result is crumbling buildings, sagging and cracked roads, the emergence of sinkholes and the collapse of community coastlines along rivers and ocean.
Wetter weather also disrupts the building of a reliable winter snowpack and safe, reliable river ice, and often challenges Indigenous communities’ efforts to harvest and secure their food.
When Typhoon Merbok hit in September 2022, fueled by unusually warm Pacific water, its hurricane-force winds, 50-foot waves and far-reaching storm surge damaged homes and infrastructure over 1,000 miles of Bering Sea coastline, and disrupted hunting and harvesting at a crucial time.

Arctic snow season is shrinking
Snow plays critical roles in the Arctic, and the snow season is shrinking.
Snow helps to keep the Arctic cool by reflecting incoming solar radiation back to space, rather than allowing it to be absorbed by the darker snow-free ground. Its presence helps lake ice last longer into spring and helps the land to retain moisture longer into summer, preventing overly dry conditions that are ripe for devastating wildfires.
Snow is also a travel platform for hunters and a habitat for many animals that rely on it for nesting and protection from predators.
A shrinking snow season is disrupting these critical functions. For example, the June snow cover extent across the Arctic is declining at a rate of nearly 20% per decade, marking a dramatic shift in how the snow season is defined and experienced across the North.
Even in the depth of winter, warmer temperatures are breaking through. The far northern Alaska town of Utqiaġvik hit 40 degrees Fahrenheit (4.4 C) – 8 F above freezing – on Dec. 5, 2022, even though the sun does not breach the horizon from mid-November through mid-January.

Fatal falls through thin sea, lake and river ice are on the rise across Alaska, resulting in immediate tragedies as well as adding to the cumulative human cost of climate change that Arctic Indigenous peoples are now experiencing on a generational scale.
Greenland ice melt means global problems
The impacts of Arctic warming are not limited to the Arctic. In 2022, the Greenland ice sheet lost ice for the 25th consecutive year. This adds to rising seas, which escalates the danger coastal communities around the world must plan for to mitigate flooding and storm surge.
In early September 2022, the Greenland ice sheet experienced an unprecedented late-season melt event across 36% of the ice sheet surface. This was followed by another, even later melt event that same month, caused by the remnants of Hurricane Fiona moving up along eastern North America.
International teams of scientists are dedicated to assessing the scale to which the Greenland ice sheet’s ice formation and ice loss are out of balance. They are also increasingly learning about the transformative role that warming ocean waters play.

This year’s Arctic Report Card includes findings from the NASA Oceans Melting Greenland (OMG) mission that has confirmed that warming ocean temperatures are increasing ice loss at the edges of the ice sheet.
Human-caused change is reshaping the Arctic
We are living in a new geological age — the Anthropocene — in which human activity is the dominant influence on our climate and environments.
In the warming Arctic, this requires decision-makers to better anticipate the interplay between a changing climate and human activity. For example, satellite-based ship data since 2009 clearly show that maritime ship traffic has increased within all Arctic high seas and national exclusive economic zones as the region has warmed.

For these ecologically sensitive waters, this added ship traffic raises urgent concerns ranging from the future of Arctic trade routes to the introduction of even more human-caused stresses on Arctic peoples, ecosystems and the climate. These concerns are especially pronounced given uncertainties regarding the current geopolitical tensions between Russia and the other Arctic states over its war in Ukraine.
Rapid Arctic warming requires new forms of partnership and information sharing, including between scientists and Indigenous knowledge-holders. Cooperation and building resilience can help to reduce some risks, but global action to rein in greenhouse gas pollution is essential for the entire planet.
Matthew L. Druckenmiller, Research Scientist, National Snow and Ice Data Center (NSIDC), Cooperative Institute for Research in Environmental Sciences (CIRES), University of Colorado Boulder; Rick Thoman, Alaska Climate Specialist, University of Alaska Fairbanks, and Twila Moon, Deputy Lead Scientist, National Snow and Ice Data Center (NSIDC), Cooperative Institute for Research in Environmental Sciences (CIRES), University of Colorado Boulder
This article is republished from The Conversation under a Creative Commons license. Read the original article.
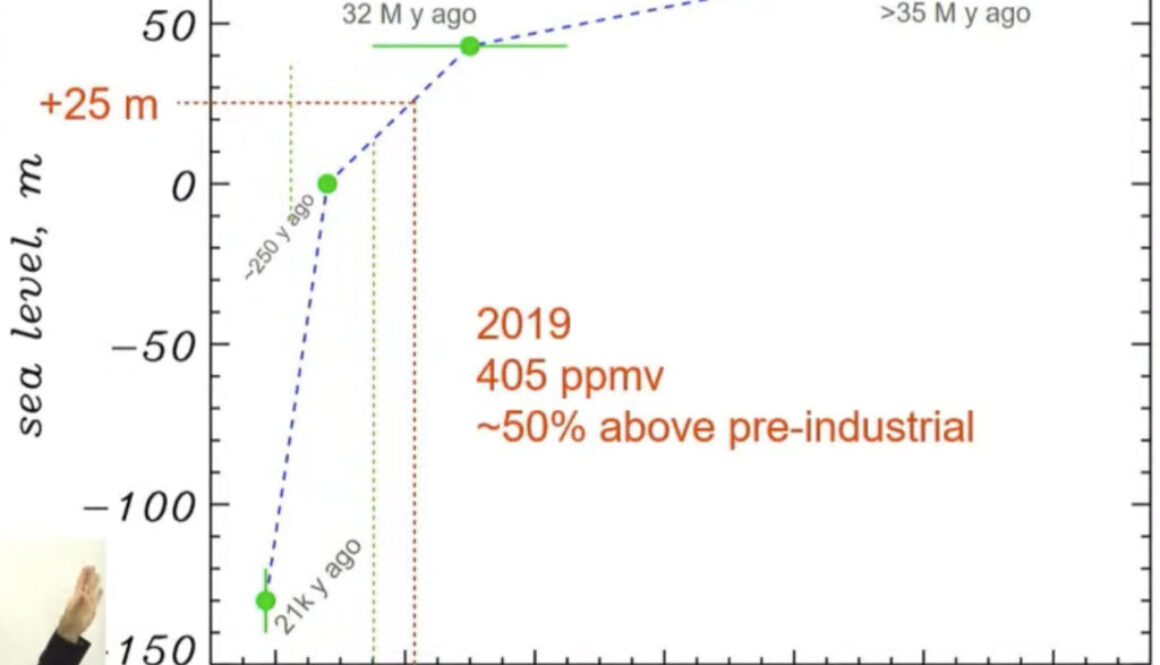
The latest State of the Cryosphere pulls no punches, so it’s worth reproducing the Forward here. Meanwhile, the Reserve Bank is vastly underestimating the residential mortgage exposure to flooding risks:
“We asked banks to identify the value of their mortgage exposures that would be affected by permanent sea level rises of 20 centimetres, 50 centimetres and 1 metre in the most severe case. This range of sea level rise is consistent with climate change modelling out from 2040 to 2100.”
A sea level rise of just 1 metre (the banks’ ‘most severe case’) by 2100 is entirely inconsistent with real world events now unfolding. COP27 was an abysmal failure. Emissions are increasing instead of decreasing. Greenland is decanting into the ocean, along with most of our mountain glaciers, and even parts of the East Antarctic Ice Sheet, which was assumed to be stable for thousands of years, are showing signs of destablising (Video 2), while…
‘Sections of the West Antarctic Ice Sheet may collapse even without further emissions, causing more than 4 meters of additional sea-level rise…’ – State of the Cryosphere 2022 (p8)
State of the Cryosphere Forward
Pam Pearson Director, ICCI
Far too much human suffering occurred in 2022 due to rapid loss of ice in the cryosphere, Earth’s snow and ice regions, from human-caused global warming.
Most occurred in places far from ice and snow: coastal sea-level rise from ice sheet loss; water shortages well downstream from shrinking glaciers and snowpack; floods, avalanches, wildfires and extreme weather events.
All were caused in whole or in part by loss of the cryosphere’s stabilizing influence on the global climate system. Our global ice stores are receding at rates unthinkable just a decade ago, whether held in ice sheets, land glaciers, permafrost or sea ice.
This State of the Cryosphere Report 2022: Growing Losses, Global Impacts especially raises up the IPCC Sixth Assessment conclusion that complete loss of Arctic sea ice in summer is now inevitable, even with the very lowest emissions pathways that peak temperatures at 1.6°C. This finding is a terminal diagnosis for that ecosystem and its essential role reflecting sunlight as the “Earth’s refrigerator,” something sea ice scientists have been warning for decades would come with continued high emissions. No one seems to have listened.
But the impending loss of Arctic summer sea ice it is not the only sign of growing cryosphere collapse. This year also saw March rains on East Antarctica, with temperatures 40°C above normal; a spike in Greenland surface melt for the first time ever in September; loss of over 5% of glacier ice in the Alps over a single summer; and the first documented rise in methane release due to global warming from a permafrost monitoring site. It also saw greater shell damage in parts of the Arctic Ocean, a clear sign of acidification; and an apparent crash in snow crab populations likely tied to warming waters.
Research published this year also shows growing convergence between ice sheet models and what paleo-climatologists (those who study Earth history going back millions of years) have warned for decades: that ice loss and irreversible sea-level rise may be occurring faster, and at lower temperatures than previously forecast: even from the massive East Antarctic Ice Sheet, with temperatures above 1.8°C. Nearly all these impacts are irreversible on human timescales. It might take only decades to melt a glacier, but centuries to thousands of years of lower temperatures to grow it back.
The message from the global cryosphere in 2022 is that we are already well into the risk zone for irreversible damage from continued loss of the planet’s global ice stores. Nevertheless, the 2022 UNFCCC Synthesis Report on reported pledges (NDCs) showed not the 45% decrease in emissions needed by 2030 to keep 1.5°C within reach, but a 10% increase by 2030.
Our planet’s melting ice pays no attention to climate pledges and NDCs. It responds only to the level of CO2 and warming in the atmosphere. In 2022, the year-on-year increase of about 2.5 ppm continued unabated, as it has for the past two decades. Until this CO2 rise slows, halts and begins to decrease, the ice will continue to respond as it always has: to the only number that really matters.
It comes as no surprise. Following COP 26, in December last year it was evident that the carbon budget to stay under 1.5C already was bankrupt. Some simple arithmetic clearly demonstrated that.
Since COP26, the ‘Don’t-Look-Up’ mentality, or perhaps the ‘war-in-Ukraine’ and ‘post-Covid-economy’ have become diversionary topics. The latest UN GAP Report begins with a clear admission, and an admonition. Nations have shaved just 1% off their projected greenhouse gas emissions for 2030, at a time when reductions need to be 45% to have even a chance to keep temperatures under 1.5C. In short, there is no credible no credible pathway in which global temperatures under that 2.8C, and “...uncertainties in the climate system mean that warming of up to 4C cannot be fully ruled out.”
These uncertainties are the dangerous tipping points explained in more detail on this website.
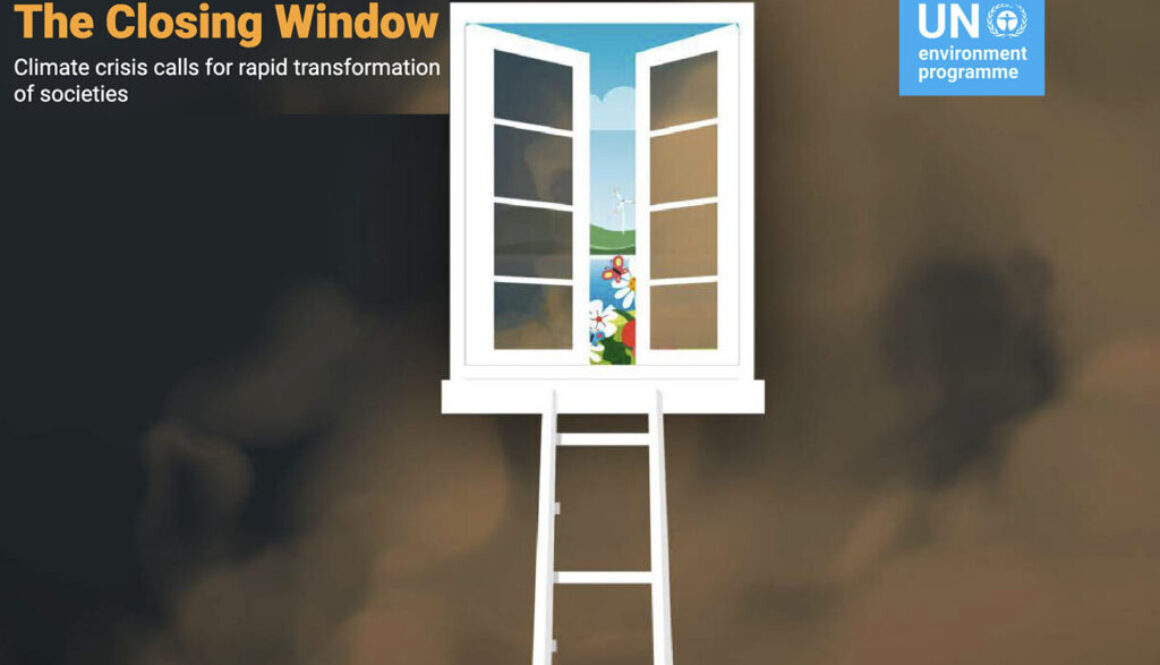
If you’re not up to reading the full report, Carbon Brief has an in depth analysis. While the report also offers solutions, the window is closing on fingernails barely clinging to the sill.
“Every year, the negative impacts of climate change become more intense. Every year, they bring more misery and pain to hundreds of millions of people across the globe. Every year, they become more a problem of the here and now, as well as a warning of tougher consequences to come. We are in a climate emergency.
“And still, as UNEP’s Emissions Gap Report 2022 shows, nations procrastinate. Since COP26 in Glasgow in 2021, new and updated nationally determined contributions (NDCs) have barely impacted the temperatures we can expect to see at the end of this century.
“This year’s report tells us that unconditional NDCs point to a 2.6°C increase in temperatures by 2100, far beyond the goals of the Paris Agreement. Existing policies point to a 2.8°C increase, highlighting a gap between national commitments and the efforts to enact those commitments. In the best- case scenario, full implementation of conditional NDCs, plus additional net zero commitments, point to a 1.8°C rise. However, this scenario is currently not credible.
“To get on track to limiting global warming to 1.5°C, we would need to cut 45 per cent off current greenhouse gas emissions by 2030. For 2°C, we would need to cut 30 per cent. A stepwise approach is no longer an option. We need system-wide transformation. This report tells us how to go about such a transformation. It looks in-depth at the changes needed in electricity supply, industry, transport, buildings and food systems. It looks at how to reform financial systems so that these urgent transformations can be adequately financed.
“Is it a tall order to transform our systems in just eight years? Yes. Can we reduce greenhouse gas emissions by so much in that timeframe? Perhaps not. But we must try. Every fraction of a degree matters: to vulnerable communities, to species and ecosystems, and to every one of us. Most importantly, we will still be setting up a carbon-neutral future: one that will allow us to bring down temperature overshoots and deliver other benefits, like clean air.
“The world is facing other crises. We must deal with them. But let us remember that they also offer opportunities to reform our global economy. We have missed the opportunity to invest in a low-carbon recovery from the COVID-19 pandemic. Now, we are in danger of missing the opportunity to boost clean and efficient energy as a response to the energy crisis. Instead of missing such opportunities, we must capitalize on them with confidence.
“I urge every nation and every community to pore over the solutions offered in this report, build them into their NDCs and implement them. I urge everyone in the private sector to start reworking their practices. I urge every investor to put their capital towards a net-zero world. The transformation begins now. ”
– Inger Anderson, Executive Director, UNEP, Emissions Gap Report 2022
By: Maurice Huguenin, PhD Candidate, UNSW Sydney; Matthew England, Scientia Professor and Deputy Director of the ARC Australian Centre for Excellence in Antarctic Science (ACEAS), UNSW Sydney, and Ryan Holmes, Research fellow, University of Sydney
Republished in full from The Conversation under a Creative Commons license. See the original article: September 7, 2022
Over the last 50 years, the oceans have been working in overdrive to slow global warming, absorbing about 40% of our carbon dioxide emissions, and over 90% of the excess heat trapped in the atmosphere.
But as our research published today in Nature Communications has found, some oceans work harder than others.
We used a computational global ocean circulation model to examine exactly how ocean warming has played out over the last 50 years. And we found the Southern Ocean has dominated the global absorption of heat. In fact, Southern Ocean heat uptake accounts for almost all the planet’s ocean warming, thereby controlling the rate of climate change.
This Southern Ocean warming and its associated impacts are effectively irreversible on human time scales, because it takes millennia for heat trapped deep in the ocean to be released back into the atmosphere.
This means changes happening now will be felt for generations to come – and those changes are only set to get worse, unless we can stop carbon dioxide emissions and achieve net zero.
It’s important yet difficult to measure ocean heating
Ocean warming buffers the worst impacts of climate change, but it’s not without cost. Sea levels are rising because heat causes water to expand and ice to melt. Marine ecosystems are experiencing unprecedented heat stress, and the frequency and intensity of extreme weather events is changing.
Yet, we still don’t know enough about exactly when, where and how ocean warming occurs. This is because of three factors.
First, temperature changes at the ocean surface and in the atmosphere just above track each other closely. This makes it difficult to know exactly where excess heat is entering the ocean.
Second, we don’t have measurements tracking temperatures over all of the ocean. In particular, we have very sparse observations in the deep ocean, in remote locations around Antarctica and under sea ice.
Last, the observations we do have don’t go back very far in time. Reliable data from deeper than 700 metres depth is virtually non-existent prior to the 1990s, apart from observations along specific research cruise tracks.

Our modelling approach
To work out the intricacies of how ocean warming has played out, we first ran an ocean model with atmospheric conditions perpetually stuck in the 1960s, prior to any significant human-caused climate change.
Then, we separately allowed each ocean basin to move forward in time and experience climate change, while all other basins were held back to experience the climate of the 1960s.
We also separated out the effects of atmospheric warming from surface wind-driven changes to see how much each factor contributes to the observed ocean warming.
By taking this modelling approach, we could isolate that the Southern Ocean is the most important absorber of this heat, despite only covering about 15% of the total ocean’s surface area.
In fact, the Southern Ocean alone could account for virtually all global ocean heat uptake, with the Pacific and Atlantic basins losing any heat gained back into the atmosphere.
One significant ecological impact of strong Southern Ocean warming is on Antarctic krill. When ocean warming occurs beyond temperatures they can tolerate, the krill’s habitat contracts and they move even further south to cooler waters.
As krill is a key component of the food web, this will also change the distribution and population of larger predators, such as commercially viable tooth and ice fish. It will also further increase stress for penguins and whales already under threat today.
So why is the Southern Ocean absorbing so much heat?
This largely comes down to the geographic set-up of the region, with strong westerly winds surrounding Antarctica exerting their influence over an ocean that’s uninterrupted by land masses.
This means the Southern Ocean winds blow over a vast distance, continuously bringing masses of cold water to the surface. The cold water is pushed northward, readily absorbing vast quantities of heat from the warmer atmosphere, before the excess heat is pumped into the ocean’s interior around 45-55°S (a latitude band just south of Tasmania, New Zealand, and the southern regions of South America).
This warming uptake is facilitated by both the warmer atmosphere caused by our greenhouse gas emissions, as well as wind-driven circulation which is important for getting heat into the ocean interior.
And when we combine the warming and wind effects only over the Southern Ocean, with the remaining oceans held back to the climate of the 1960s, we can explain almost all of the global ocean heat uptake.
But that’s not to say the other ocean basins aren’t warming. They are, it’s just that the heat they gain locally from the atmosphere cannot account for this warming. Instead, the massive heat uptake in the Southern Ocean is what has driven changes in total ocean heat content worldwide over the past half century.
We have much to learn
While this discovery sheds new light on the Southern Ocean as a key driver of global ocean warming, we still have a lot to learn, particularly about ocean warming beyond the 50 years we highlight in our study. All future projections, including even the most optimistic scenarios, predict an even warmer ocean in future.
And if the Southern Ocean continues to account for the vast majority of ocean heat uptake until 2100, we might see its heat content increase by as much as seven times more than what we have already seen up to today.
This will have enormous impacts around the globe: including further disturbances to the Southern Ocean food web, rapid melting of Antarctic ice shelves, and changes in the ocean conveyor belt.
To capture all of these changes, it’s vital we continue and expand our observations taken in the Southern Ocean.
One of the most important new data streams will be new ocean floats that can measure deeper ocean temperatures, as well as small temperature sensors on elephant seals, which give us essential data of oceanic conditions in winter under Antarctic sea ice.
Even more important is the recognition that the less carbon dioxide we emit, the less ocean change we will lock in. This will ultimately limit the disruption of livelihoods for the billions of people living near the coast worldwide.
