Nature-based solutions: Wetlands
Image: Jeff Ballar
Wetlands in Canterbury include:
- Estuaries such as the Heathcote & Avon Rivers Ihutai, and Ashley Rakahuri river mouth
- Coastal wetlands such as Tuhaitara Coastal Park
- Coastal lagoons such as Wainono Lagoon (restoration supported MfE, DOC and ECan)
- Margins of the shallow, brackish Lake Ellesmere/Te Waihora such as Te Ahuriri and
- Near coastal wetlands on private land such as Ladino Wetland
- Freshwater such as Travis wetland (managed by Christchurch City Council)
- Margins of the Ashburton and Sumner lakes
- Ephemeral ‘kettlehole tarns‘ in the glacial moraines of the high country
- See Environment Canterbury’s wetlands page
Environment Canterbury manages 59 river and drainage rating districts (i.e. areas where ratepayers contribute to the cost of flood protection). This map shows each rating district around rivers.
Areas outside these zones are not protected from floods.
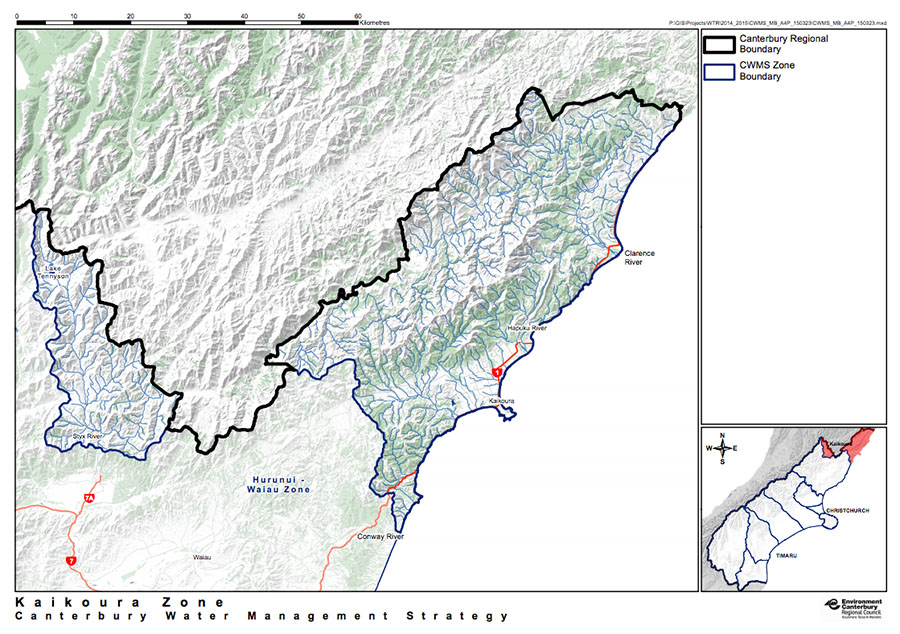
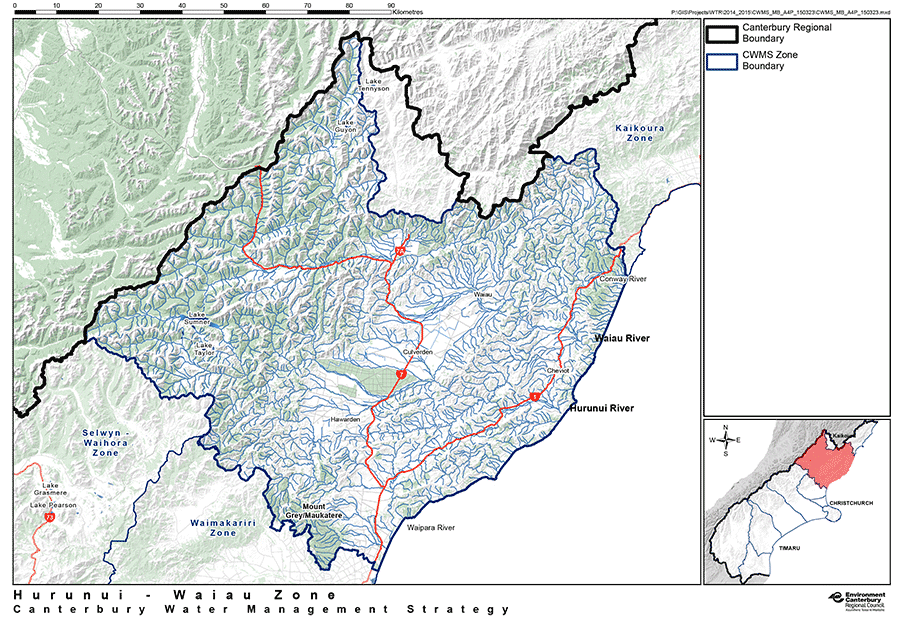
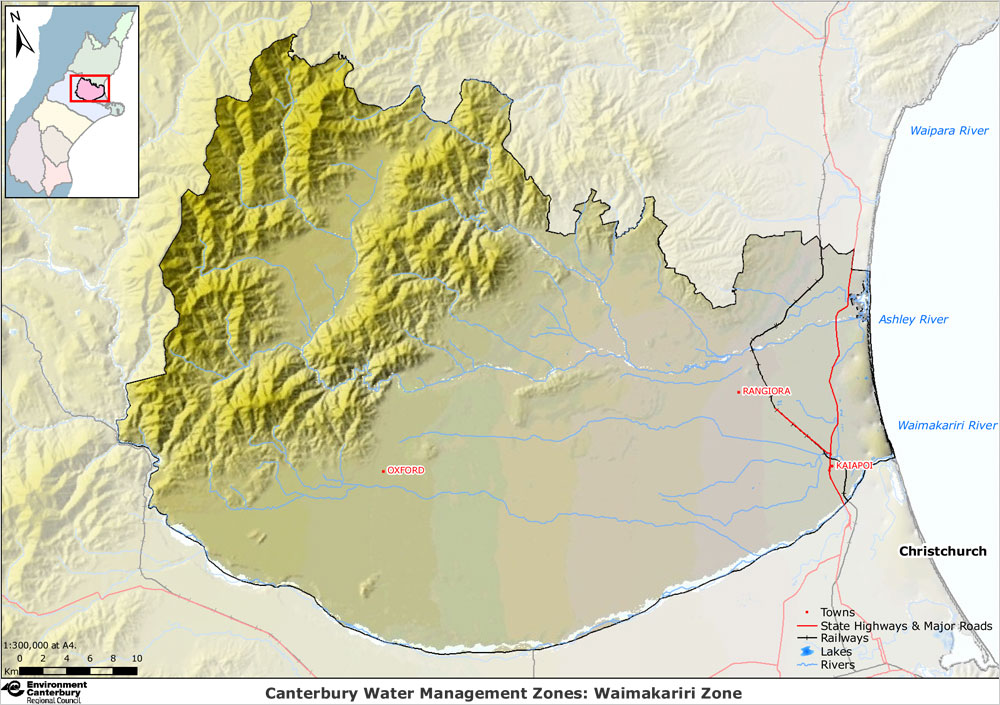
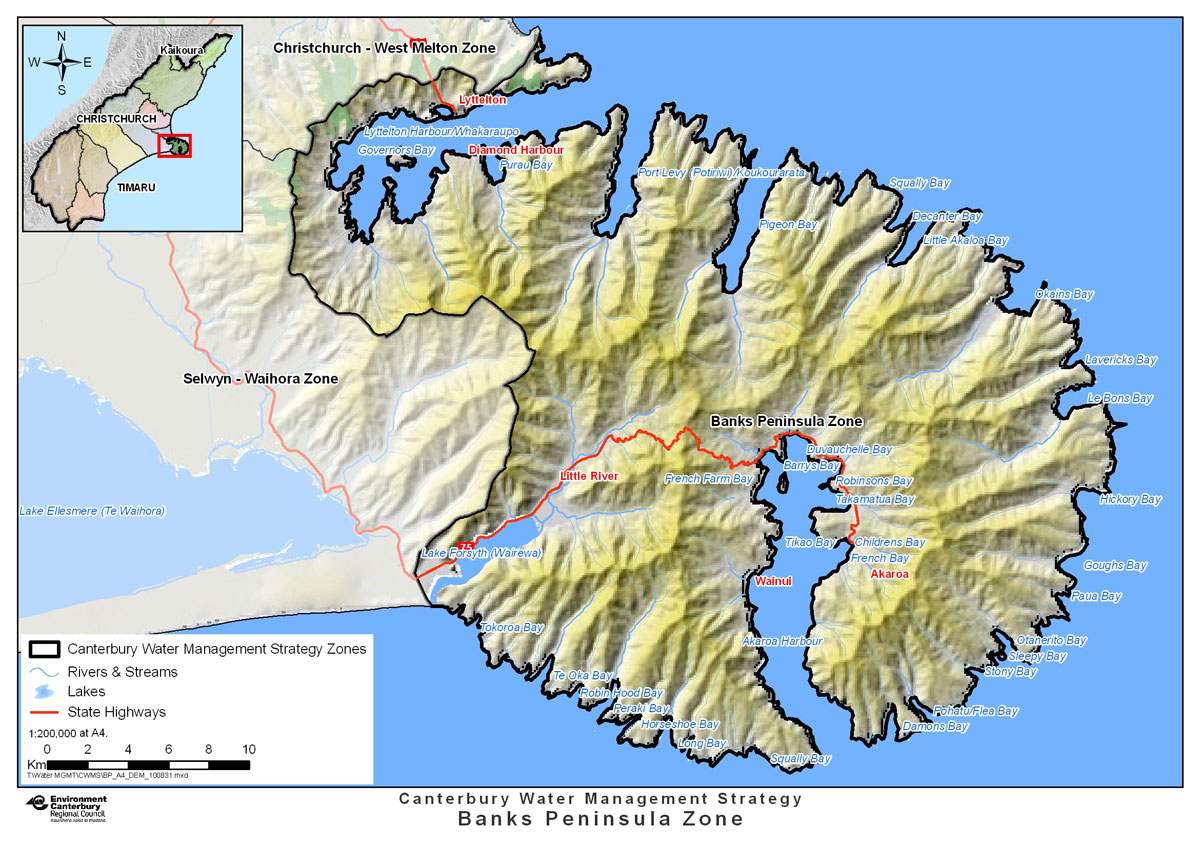
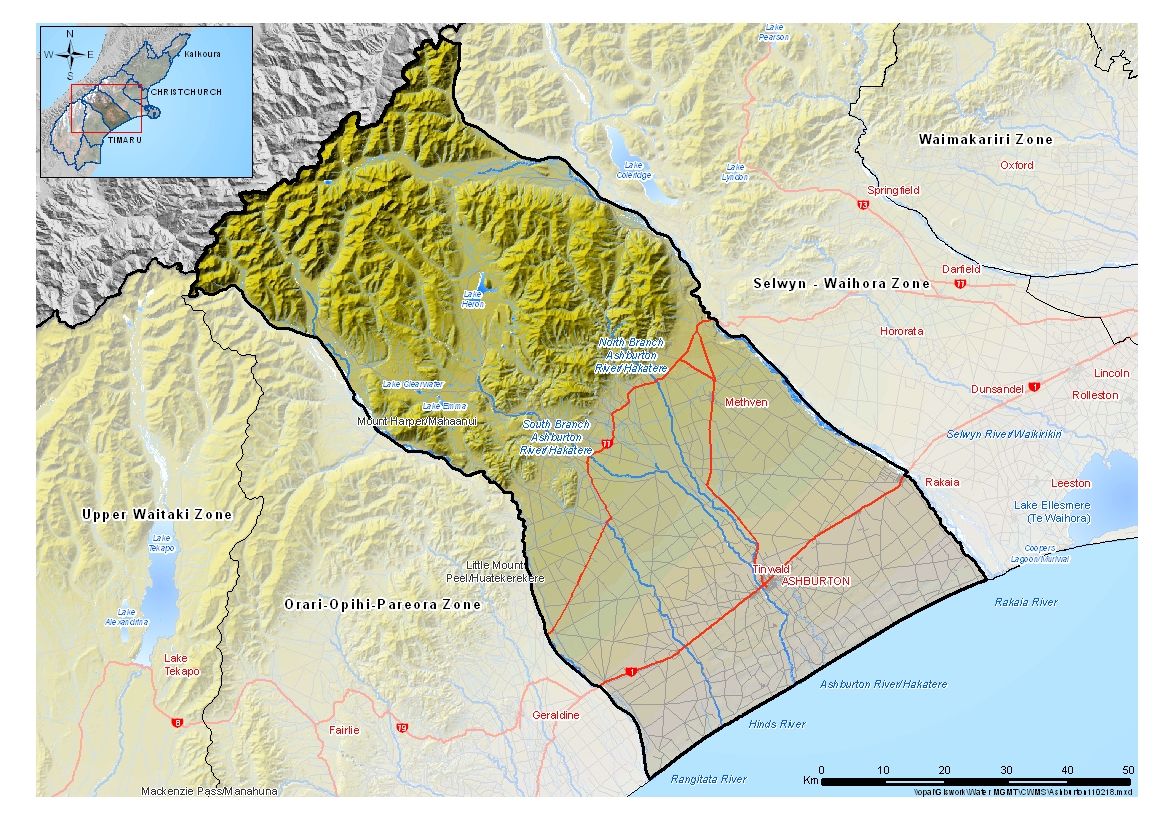
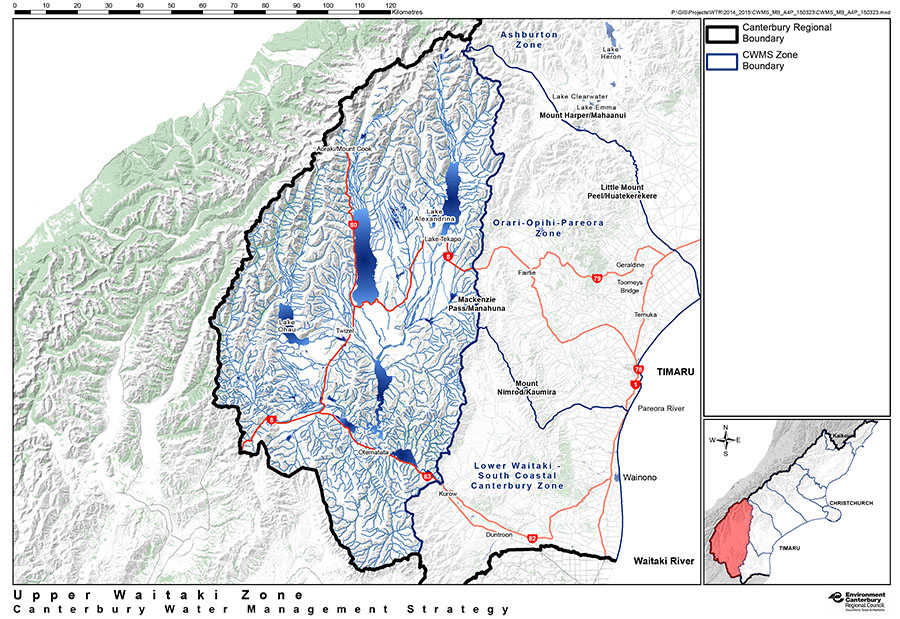
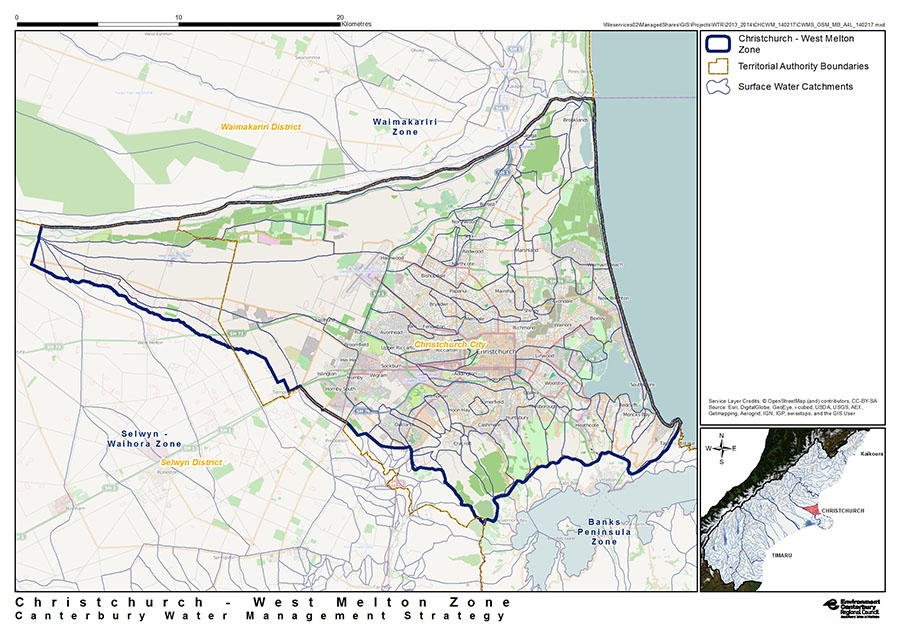
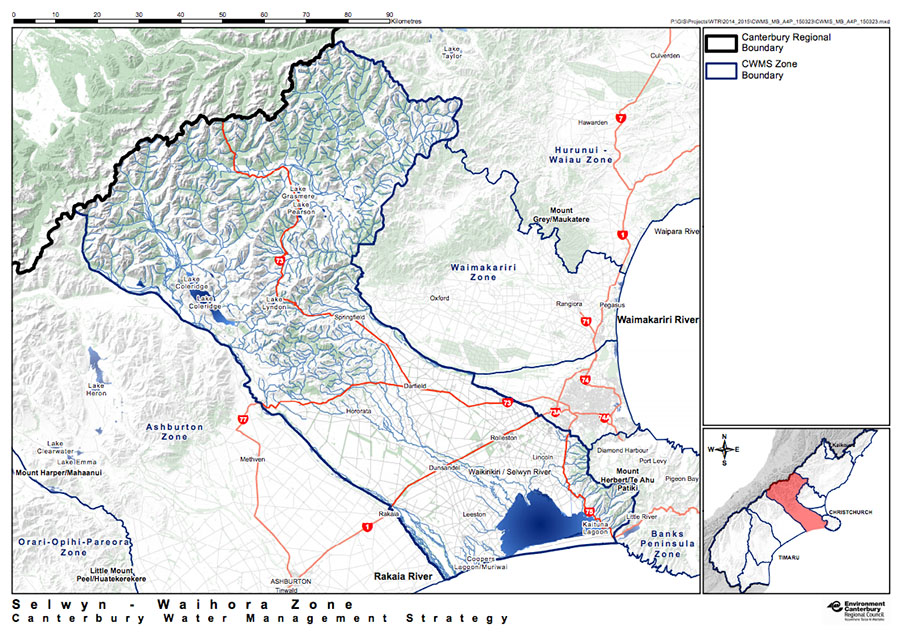
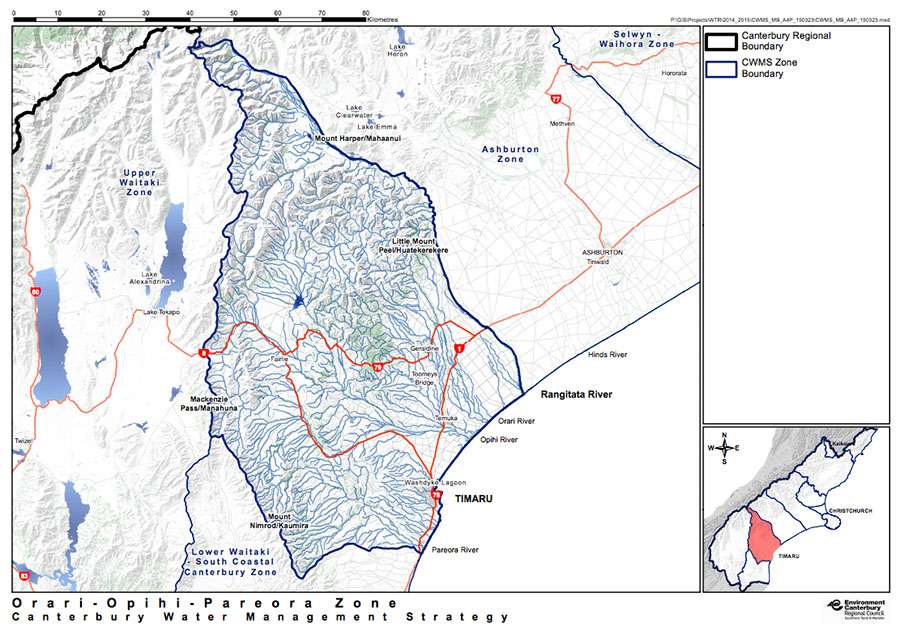
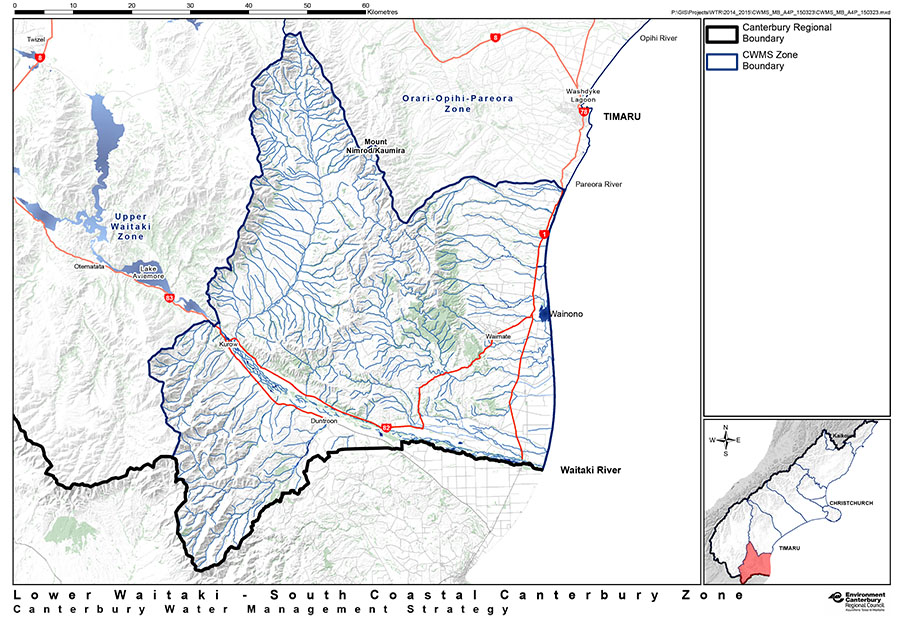
Under the Canterbury Water Management Strategy, the catchment of each waterway—their wetlands, groundwater, springs, lakes and rivers that flow down to estuaries—is considered together. Managing catchments in this integrated way means problems can be considered based on each catchment’s unique attributes. These maps will help you identify which catchment zone you are in.
Note that while there is overlap, these zone are not the same as river-ratings districts.
The problems
“Since the 2012…over a hundred thousand hectares of true land-use change [has been] going on around wetlands, scrub being cleared, and dairy land-use intensification.” – Landcare Research, 2020
“Even the most egregious offences – including a dam built on a wetland, clearance of a nationally endangered form of kānuka, and aerial poisoning of swathes of regenerating native bush – often prompted little more than a warning from authorities.” – Charlie Mitchell, Stuff, 2020
The Resource Management Act (RMA) required councils to preserve “the natural character of the coastal environment (including the coastal marine area), wetlands, and lakes and rivers and their margins” and protect them from “inappropriate subdivision, use, and development”.
Yet since the RMA came into force in 1992, along with rivers, wetlands continue to be drained, destroyed, and converted to intensive agriculture.
The National Policy Statement for Freshwater Management 2020 requires better management of wetlands but loopholes and inconsistency hinders compliance and enforcement. Many vegetation clearance rules are still discretionary (i.e. councils can decide whether or not to grant a clearance consent) and degraded wetlands are often deemed unworthy of protection. Even defining the types of wetland and their values is confusing. As some lobbyists in the agricultural sector and elected officials regard policies to improve waterways as a hindrance to economic development (see Video 1 on the rivers page), loopholes are easily exploited and enforcement is rare and in some councils, virtually non-existent.
“I remain concerned about council capacity to implement these new policies, especially given most councils were struggling to implement the freshwater reform package passed by the previous National government.” – Dr Nicholas Kirk, Environmental Social Researcher, Manaaki Whenua – Landcare Research
“Almost 5400 hectares of freshwater wetland vegetation and almost 140 hectares of saline wetland vegetation was destroyed through human actions between 1996 and 2018. Over 90% was converted to grassland for grazing. The greatest period of loss was between 2008 and 2012, with an average loss of 370 hectares of freshwater wetlands per year… Most councils have appropriate policy objectives, and all regional plans have wetland drainage rules, however they vary in strength, with several failing to control wetland vegetation clearance, and some only providing for a sub-set of ‘regionally significant wetlands’. These factors combined to create a loophole for wetland loss – vegetation could be cleared as a permitted activity, stripping the site of its significance and enabling drainage without the need for any resource consents.
“Councils have rarely declined wetland-related consents (>50% approved), and the public have rarely been given a say (>50% consent applications non- notified and processed by council staff rather than elected representatives)…
Lack of enforcement appears to be a major contributing factor, with an apparently low risk of penalty for illegal drainage, and few ‘example-setting’ prosecutions to encourage compliance with rules and consent conditions.
One retrospective consent we investigated failed to consider a restoration option, instead deciding that ‘because the damage has already occurred, the Council considers it appropriate to complete the works to convert the marginal land into pasture and acknowledges that while some habitat and species diversity may be lost, the requirement to fence will provide some protection to a small area that still remains.’
“The apparent rarity of prosecutions, and weak penalties for breaches may facilitate and encourage weak public compliance with wetland rules.” – National Wetlands Trust
The solutions: key actions
Protect what remains to save their essential ecosystem services and prevent the CO2 stored in them from being released when they are damaged or destroyed.
Robust unambiguous policies must be created and compliance must be enforced.
Recognise the role of wetlands in mitigating climate change: The ongoing loss of wetlands is NOT being accounted for in the current Emissions Trading Scheme (ETS).This need to be urgently addressed.
Because we have lost so many wetlands, bringing them into the ETS presents an opportunity to drawdown and store large quantities of CO2, turning wetlands into a direct source of revenue.
Rapidly restore, replace, and expand damaged and depleted wetlands: Where opportunities arise to protect and enhance them, this should be encouraged as smaller wetlands are often hydrologically linked to larger waterways and may provide the last remaining refuges for critically endangered species. Restoring half a dozen tiny wetlands (Video 1) could restore critical hydrological links between multiple larger ecosystems.
Restore wetlands in consideration of the broader context. For example, some freshwater coastal wetlands are likely to become increasingly brackish as sea levels rise. Tuhaitara Coastal Park has planted saltwater tolerant species, which are thriving alongside freshwater species (Video 2), to help enable this transition.
Wetlands exist within quite different ecosystems from the mountains to the sea. For example, healthy freshwater wetlands filter out some nitrates produced by intensive agriculture. However, if nitrate levels are too high, this may inhibit carbon sequestration:
“Salt marshes sequester carbon at rates more than an order of magnitude greater than their terrestrial counterparts, helping to mitigate climate change. As nitrogen loading to coastal waters continues, primarily in the form of nitrate, it is unclear what effect it will have on carbon storage capacity of these highly productive systems. ” – Bulskeo et al (2019)
Find out what catchment you’re in and which zone committee you can speak to about helping to protect and restore wetlands and waterways in your area, by clicking on the catchment maps below:
