2023 is confirmed as the warmest calendar year in global temperature data records going back to 1850
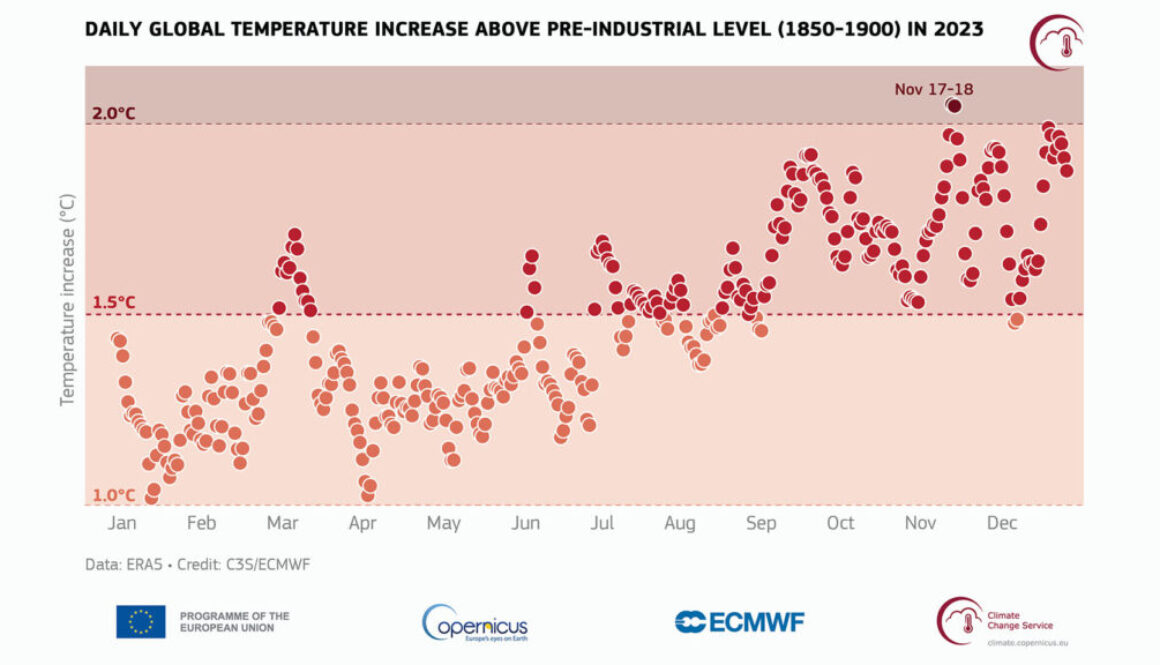
2023 had a global average temperature of 14.98°C, 0.17°C higher than the previous highest annual value in 2016
2023 was 0.60°C warmer than the 1991-2020 average and 1.48°C warmer than the 1850-1900 pre-industrial level
It is likely that a 12-month period ending in January or February 2024 will exceed 1.5°C above the pre-industrial level
2023 marks the first time on record that every day within a year has exceeded 1°C above the 1850-1900 pre-industrial level. Close to 50% of days were more than 1.5°C warmer then the 1850-1900 level, and two days in November were, for the first time, more than 2°C warmer.
Annual average air temperatures were the warmest on record, or close to the warmest, over sizeable parts of all ocean basins and all continents except Australia
Each month from June to December in 2023 was warmer than the corresponding month in any previous year
July and August 2023 were the warmest two months on record. Boreal summer (June-August) was also the warmest season on record
September 2023 was the month with a temperature deviation above the 1991–2020 average larger than any month in the ERA5 dataset
December 2023 was the warmest December on record globally, with an average temperature of 13.51°C, 0.85°C above the 1991-2020 average and 1.78°C above the 1850-1900 level for the month. You can access information specific for December 2023 in our monthly bulletin
Our planet has warmed by about 1.2°C since 1850. But this warming is not uniform. Warming at the poles, especially the Arctic, has been three to four times faster than the rest of the globe. It’s a phenomenon known as “polar amplification”.
Climate models simulate this effect, but when tested against the past 40 years of warming, these models fall short. The situation is even worse when it comes to modelling past climates with very high levels of greenhouse gases.
This is a problem because these are the same models used to project into the future and forecast how the climate will change. They are likely to underestimate what will happen later this century, including risks such as ice sheet melting or permafrost thawing.
In our new research published today in Nature Geoscience we used a high-resolution model of the atmosphere that includes the stratosphere. We found a special type of cloud appears over polar regions when greenhouse gas concentrations are very high. The role of this type of cloud has been overlooked so far. This is one of the reasons why our models are too cold at the poles.
Polar Stratospheric Clouds over Norway (Night Lights Films – Adrien Mauduit)
Back to the future
Looking into past climates can give us glimpses of possible futures for a range of extreme conditions. For us, this means we can use Earth’s history to find out how well our climate models perform. We can test our models by simulating episodes in the past when Earth was much warmer. The advantage of this is that we have temperature reconstructions for these episodes to evaluate the models, as opposed to the future, for which measurements are not available.
If we go back 50 million years or so, our planet was very hot. Carbon dioxide (CO₂) concentrations ranged between 900 and 1,900 parts per million (ppm), compared with 415 ppm today. Methane (CH₄) concentrations were likely also much higher.
Canada’s arctic archipelago was covered in lush rainforests inhabited by alligators, turtles, lizards and mammals.
For these plants and animals to survive, conditions must have been warm and ice-free year-round. Indeed, surface ocean temperatures exceeded 20°C near the north pole (at about 87°N) and 25°C in the Southern Ocean (at about 67°S).
This period called the early Eocene is a perfect test bed for our models, because it was globally very warm, and the poles were even warmer, meaning it was a climate with extreme polar amplification. In addition, the Eocene is recent enough for temperature reconstructions to be available.
But as it turns out, the models fail again. They are much too cold at high latitudes. What are our models missing?
Polar stratospheric clouds
In 1992 American paleoclimatologist Lisa Sloan suggested polar stratospheric clouds might have caused extreme warming at high latitudes in the past.
These clouds are a rare and beautiful sight today. They are also called nacreous or mother-of-pearl clouds for their vivid and sometimes luminous colours.
They form at very high altitudes (in the stratosphere) and at very low temperatures (over the poles). In the present day climate, they appear mainly over Antarctica, but have also been observed during winter months over Scotland, Scandinavia and Alaska, at times when the stratosphere was particularly cold.
Just like greenhouse gases, they absorb infrared radiation emitted by the Earth’s surface and re-emit a portion of this energy back to the surface. This suggests polar stratospheric clouds could be one of the missing puzzle pieces.
They warm the surface. And their effect could be significant, especially in winter, when the sun does not rise. But they are difficult to simulate in a climate model, so most models ignore them. This omission could explain why climate models miss some of the polar warming, because they miss a process that warms the poles.
Three decades after Sloan’s paper, a few atmosphere models are finally complex enough to allow us to test her hypothesis. In our research we use one of them and find that under certain conditions, the additional warming due to these polar stratospheric clouds exceeds 7°C during the winter months. This significantly reduces the gap between climate models and temperature evidence from the early Eocene. Sloan was right.
Implications for future projections
Our research explains why climate models don’t work so well for past climates when greenhouse gas levels were much higher than they are today. But what about the future? Should we be concerned?
There is some good news. While polar stratospheric clouds do warm the poles, they won’t be as common in the future as they were in the distant past, even if both CO₂ and CH₄ reach very high levels.
This is due to another difference between the Eocene and today: the position of continents and mountains, which were different back then and which also influence the formation of polar stratospheric clouds. So even if we hit early Eocene levels of CH₄ and CO₂ in the future, we would expect less polar stratospheric cloud to be formed. This suggests the standard climate models are better at predicting the future than the past.
It’s therefore unlikely the Arctic and Antarctica will be covered by these beautiful clouds anytime soon. But our research shows evidence from past climates can reveal processes that only become important when greenhouse gas concentrations are high. Some of these processes are not included in our models because models are tested against present day observations and other processes simply seemed more important to include. Looking into the past is a way of broadening our horizon and learning for the future.
Exceeding 1.5°C temporarily, and just fust for one month, does not mean the Paris Agreement goal of staying under 1.5°C is lost, as September is generally the hottest month on Earth. However, a temporary rise above 1.5° is likely to trigger some irreversible tipping points.
Current policies and actions make it very likely, at least temporarily, to overshoot the Paris climate targets of 1.5–<2.0 °C above pre-industrial levels. If this global warming range is exceeded, potential tipping elements such as the Greenland Ice Sheet and Amazon rainforest may be at increasing risk of crossing critical thresholds. This raises the question of how much this risk is amplified by increasing overshoot magnitude and duration. …Our model analysis reveals that temporary overshoots can increase tipping risks by up to 72% compared with non-overshoot scenarios, even when the long-term equilibrium temperature stabilizes within the Paris range.
The situation in Antarctica, both what’s currently being observed and the latest research, and the consequences are succinctly explained by Prof. Nerilie Abrahm from the Australian National University. Further consequences are discussed in the second half of the video.
Beneath our feet, remarkable networks of fungal filaments stretch out in all directions. These mycorrhizal fungi live in partnership with plants, offering nutrients, water and protection from pests in exchange for carbon-rich sugars.
How much bigger? These microscopic filaments take up the equivalent of more than a third (36%) of the world’s annual carbon emissions from fossil fuels – every year.
As we search for ways to slow or stop the climate crisis, we often look to familiar solutions: cutting fossil fuel use, switching to renewables and restoring forests. This research shows we need to look down too, into our soils.
This fungi-plant partnership is 400 million years old
Mycorrhizal fungi are hard to spot, but their effects are startling. They thread networks of microscopic filaments through the soil and into the roots of almost every plant on earth.
But this is no hostile takeover. They’ve been partnering with plants for more than 400 million years. The length of these complex relationships has given them a vital role in our ecosystems.
Sometimes fungi take more than they give. But often, these are relationships of mutual benefit. Through their network, the fungi transport essential nutrients and water to plants, and can even boost their resistance to pests and disease.
In return, plants pump sugars and fat made by photosynthesis in their leaves down through their roots to the fungi. These compounds are rich in carbon, taken from the atmosphere.
How do these fungi fit into the carbon cycle?
On land, the natural carbon cycle involves a delicate balance. Plants take CO₂ from the atmosphere through photosynthesis, while other organisms emit it back into the atmosphere.
Now we know the carbon transfer from plants to mycorrhizal fungi isn’t a side note – it’s a substantial part of this equation.
By analysing almost 200 datasets, the researchers estimate the world’s plants are transferring a staggering 3.58 billion tonnes of carbon per year to this underground network. That’s the same as 13.12 billion tonnes of CO₂ – more than a third of the world’s 36.3 billion tonnes of CO₂ emitted yearly by burning fossil fuels.
To be clear, fungal carbon doesn’t present a climate solution by itself. It’s a missing piece in the carbon cycle puzzle.
We still have big gaps in data from particular ecosystems and geographic regions. For instance, this study didn’t have any data of this kind from Australia or Southeast Asia – because it doesn’t yet exist.
What does this mean for the climate?
We already know mycorrhizal fungi help soils retain carbon by releasing specific chemical compounds. These compounds contain carbon and nitrogen. Once in the soil, these compounds can be used by other soil microorganisms, such as bacteria. When this happens it helps to form a highly stable soil carbon store that is more resistant to breakdown, and this store can accumulate more than four times faster in the presence of mycorrhizal fungi.
When these fungi die, they leave behind “necromass” – a complex scaffold of dead organic material which can be stored in soil, and often inside clumps of soil particles. The carbon inside these clumps can stay in the soil for close to a decade without being released back to the atmosphere.
In fact, other studies suggest this fungal necromass might contribute more to the carbon content of soil than living fungi.
But these fungi also naturally cause carbon to escape back to the atmosphere by decomposing organic matter or changing water and nutrient availability, which influences how other organisms decompose. Mycorrhizal fungi also release some carbon back into the atmosphere, though the rate this happens depends on many factors.
What does this mean for climate change? While atmospheric CO₂ concentrations keep rising, it doesn’t necessarily mean fungi are storing more of it. Recent research in an Australian woodland found higher atmospheric CO₂ did see more carbon sent below the ground. But this carbon wasn’t stored for long periods.
When we cut down forests or clear land, we not only disrupt life above the ground, but underground as well. We need to safeguard these hidden fungal networks which give our plants resilience – and play a key role in the carbon cycle.
As we better understand how these fungi work and what we’re doing to them, we can also develop farming methods which better preserve them and their carbon.
We’ve long overlooked these vital lifeforms. But as we learn more about how fungi and plants cooperate and store carbon, it’s well past time for that to change.
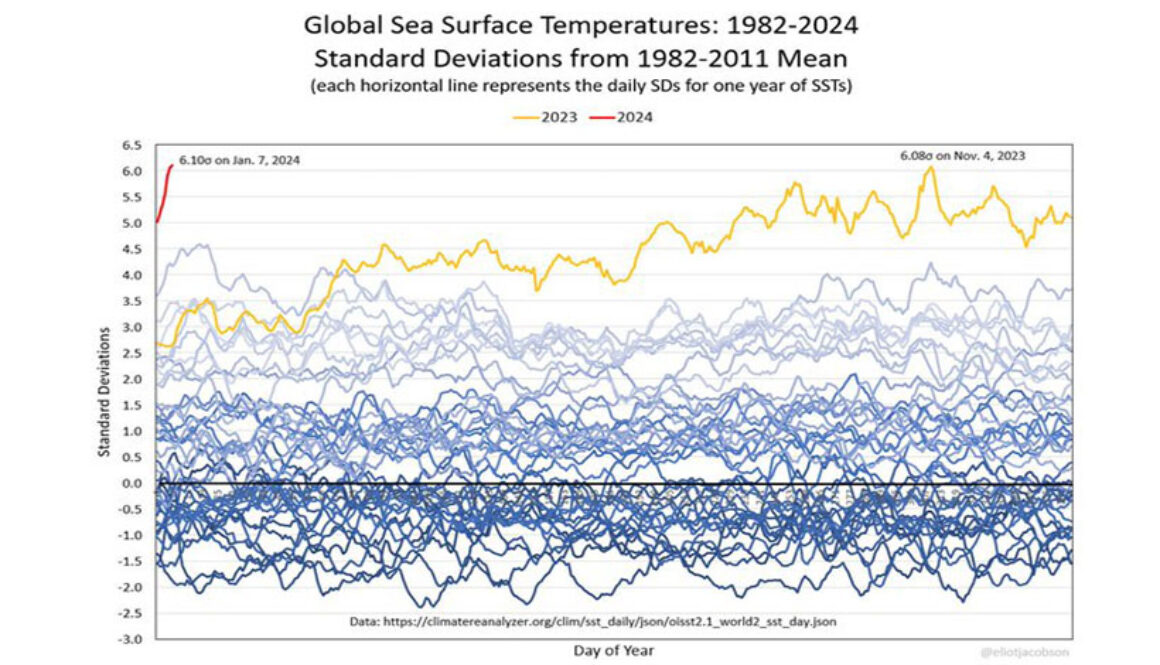
‘UNCHARTED TERRITORY’: Since mid-March, global average sea surface temperatures have been higher than at any time since records began in 1982, fuelling concerns that Earth is entering “uncharted territory” because of climate change, the Guardian reported. Global sea surface temperatures reached 21.1C at the start of April, topping the previous high of 21C in March 2016, according to data from the US National Oceanic and Atmospheric Administration.
The Guardian added that these temperatures typically dip towards the end of April after reaching their annual peak in March or early April, but that temperatures have remained high this year for the first time since records began. The record ocean heat has “scientists scratching their heads”, Prof Mike Meredith, a researcher from the British Antarctic Survey, said to the Guardian. He told the publication: “The fact that it is warming as much as it has been is a real surprise and very concerning. It could be a short-lived extreme high, or it could be the start of something much more serious.”
EL NIÑO INCOMING: The Guardian noted that the world is currently on the cusp of an El Niño, a periodic natural phenomenon in the tropical Pacific Ocean that affects many regions, causing a warming impact globally. “But the El Niño system is yet to develop, so this oscillation cannot explain the recent rapid heating,” the publication said. However, Axios reported that some climate scientists do think the pulse in ocean heat could be related to El Niño – specifically, the transition to El Niño from La Niña, the climate pattern that acts as El Niño’s opposite. Axios said: “When a La Niña event gives way to an El Niño, as is happening now, large amounts of ocean heat that had been lurking beneath the ocean surface is drawn upwards, according to Michael Mann, a climate scientist at the University of Pennsylvania. The result, Mann told Axios via email, is ‘a sizable increase’ in tropical Pacific and global ocean surface temperatures during the transition.”
STEP CHANGE: The ocean surface temperature spike is likely to also reflect the fact that, since the last major El Niño in 2016, global average surface temperatures on land and sea have increased because of climate change, scientists told Axios. It reported: “This means the 2023 El Niño is elevating global average temperatures from a higher starting point, making it easier to set records. This is like a basketball player playing on a court with a steadily higher floor, making it easier to dunk the basketball.” BBC News also reported on how the spike in ocean temperatures could represent the impact of El Niño combining with human-caused climate change. It reported: “Some research has shown that the world is warming in jumps, where little changes over a period of years and then there are sudden leaps upwards, like steps on a stairs, closely linked to the development of El Niño.”
Several scientists contacted by BBC News were “reluctant to go on the record about the implications” of such step changes, according to the article. It added: “One spoke of being ‘extremely worried and completely stressed’.”
Interviewed: David Karoly Honorary Professor, The University of Melbourne; Friederike Otto Senior Lecturer in Climate Science, Imperial College London, Tannecia Stephenson Physics Professor, University of the West Indies, Mona Campus
It showed global temperatures are now 1.1℃ above pre-industrial levels. This warming has driven widespread and rapid global changes, including more frequent and intense weather extremes that are now impacting people and ecosystems all over the world.
But when an extreme weather event hits, how certain can we be that it was made more likely by climate change? How do we know it wasn’t just a rare, naturally-occuring event that might have happened anyway?
Fear & Wonder is a new podcast from The Conversation that takes you inside the UN’s era-defining climate report via the hearts and minds of the scientists who wrote it.
The show is hosted by Dr Joëlle Gergis – a climate scientist and IPCC lead author – and award-winning journalist Michael Green.
In this episode, we’re delving into one of the major shifts in the public communication of climate change – the attribution of extreme weather events to climate change.
Although in the past we knew climate change was making extreme weather more likely, advances in climate modelling now allow scientists to pinpoint the influence of natural and human-caused factors on individual weather extremes.
We speak to climatologist Dr Friederike Otto about a rapid attribution study of a heatwave in Toulouse, France, as it unfolded in 2019. We also hear from climatologist Professor David Karoly to help us understand how climate models actually work, while Professor Tannecia Stephenson explains how global models are then used to develop regional climate change projections over the Caribbean island of Jamaica.
To listen and subscribe, click here, or click the icon for your favourite podcast app in the graphic above.
Fear and Wonder is sponsored by the Climate Council, an independent, evidence-based organisation working on climate science, impacts and solutions.
The rhythmic expansion and contraction of Antarctic sea ice is like a heartbeat.
But lately, there’s been a skip in the beat. During each of the last two summers, the ice around Antarctica has retreated farther than ever before.
And just as a change in our heartbeat affects our whole body, a change to sea ice around Antarctica affects the whole world.
Today, researchers at the Australian Antarctic Program Partnership (AAPP) and the Australian Centre for Excellence in Antarctic Science (ACEAS) have joined forces to release a science briefing for policy makers, On Thin Ice.
Together we call for rapid cuts to greenhouse gas emissions, to slow the rate of global heating. We also need to step up research in the field, to get a grip on sea-ice science before it’s too late.
The shrinking white cap on our blue planet
One of the largest seasonal cycles on Earth happens in the ocean around Antarctica. During autumn and winter the surface of the ocean freezes as sea ice advances northwards, and then in the spring the ice melts as the sunlight returns.
We’ve been able to measure sea ice from satellites since the late 1970s. In that time we’ve seen a regular cycle of freezing and melting. At the winter maximum, sea ice covers an area more than twice the size of Australia (roughly 20 million square kilometres), and during summer it retreats to cover less than a fifth of that area (about 3 million square km).
In 2022 the summer minimum was less than 2 million square km for the first time since satellite records began. This summer, the minimum was even lower – just 1.7 million square km.
By exchanging water between the surface ocean and the abyss, sea ice formation helps to sequester heat and carbon dioxide in the deep ocean. It also helps to bring long-lost nutrients back up to the surface, supporting ocean life around the world.
Not only does sea ice play a crucial role in pumping seawater across the planet, it insulates the ocean underneath. During the long days of the Antarctic summer, sunlight usually hits the bright white surface of the sea ice and is reflected back into space.
This year, there is less sea ice than normal and so the ocean, which is dark by comparison, is absorbing much more solar energy than normal. This will accelerate ocean warming and will likely impede the wintertime growth of sea ice.
Headed for stormy seas
The Southern Ocean is a stormy place; the epithets “Roaring Forties” and “Furious Fifties” are well deserved. When there is less ice, the coastline is more exposed to storms. Waves pound on coastlines and ice shelves that are normally sheltered behind a broad expanse of sea ice. This battering can lead to the collapse of ice shelves and an increase in the rate of sea level rise as ice sheets slide off the land into the ocean more rapidly.
Sea ice supports many levels of the food web. When sea ice melts it releases iron, which promotes phytoplankton growth. In the spring we see phytoplankton blooms that follow the retreating sea ice edge. If less ice forms, there will be less iron released in the spring, and less phytoplankton growth.
Krill, the small crustaceans that provide food to whales, seals, and penguins, need sea ice. Many larger species such as penguins and seals rely on sea ice to breed. The impact of changes to the sea ice on these larger animals varies dramatically between species, but they are all intimately tied to the rhythm of ice formation and melt. Changes to the sea-ice heartbeat will disrupt the finely balanced ecosystems of the Southern Ocean.
A diagnosis for policy makers
Long term measurements show the subsurface Southern Ocean is getting warmer. This warming is caused by our greenhouse gas emissions. We don’t yet know if this ocean warming directly caused the record lows seen in recent summers, but it is a likely culprit.
As scientists in Australia and around the world work to understand these recent events, new evidence will come to light for a clearer understanding of what is causing the sea ice around Antarctica to melt.
If you noticed a change in your heartbeat, you’d likely see a doctor. Just as doctors run tests and gather information, climate scientists undertake fieldwork, gather observations, and run simulations to better understand the health of our planet.
This crucial work requires specialised icebreakers with sophisticated observational equipment, powerful computers, and high-tech satellites. International cooperation, data sharing, and government support are the only ways to provide the resources required.
After noticing the first signs of heart trouble, a doctor might recommend more exercise or switching to a low-fat diet. Maintaining the health of our planet requires the same sort of intervention – we must rapidly cut our consumption of fossil fuels and improve our scientific capabilities.
The Antarctic Ice Sheet, which covers an area greater than the US and Mexico combined, holds enough water to raise global sea level by more than 57 metres if melted completely. This would flood hundreds of cities worldwide. And evidence suggests it is melting fast. Satellite observations have revealed that grounded ice (ice that is in contact with the bed beneath it) in coastal areas of West Antarctica has been lost at a rate of up to 30 metres per day in recent years.
But the satellite record of ice sheet change is relatively short as there are only 50 years’ worth of observations. This limits our understanding of how ice sheets have evolved over longer periods of time, including the maximum speed at which they can retreat and the parts that are most vulnerable to melting.
So, we set out to investigate how ice sheets responded during a previous period of climatic warming – the last “deglaciation”. This climate shift occurred between roughly 20,000 and 11,000 years ago and spanned Earth’s transition from a glacial period, when ice sheets covered large parts of Europe and North America, to the period in which we currently live (called the Holocene interglacial period).
During the last deglaciation, rates of temperature and sea-level rise were broadly comparable to today. So, studying the changes to ice sheets in this period has allowed us to estimate how Earth’s two remaining ice sheets (Greenland and Antarctica) might respond to an even warmer climate in the future.
Our recently published results show that ice sheets are capable of retreating in bursts of up to 600 metres per day. This is much faster than has been observed so far from space.
Pulses of rapid retreat
Our research used high-resolution maps of the Norwegian seafloor to identify small landforms called “corrugation ridges”. These 1–2 metre high ridges were produced when a former ice sheet retreated during the last deglaciation.
Tides lifted the ice sheet up and down. At low tide, the ice sheet rested on the seafloor, which pushed the sediment at the edge of the ice sheet upwards into ridges. Given that there are two low tides each day off Norway, two separate ridges were produced daily. Measuring the space between these ridges enabled us to calculate the pace of the ice sheet’s retreat.
During the last deglaciation, the Scandinavian Ice Sheet that we studied underwent pulses of extremely rapid retreat – at rates between 50 and 600 metres per day. These rates are up to 20 times faster than the highest rate of ice sheet retreat that has so far been measured in Antarctica from satellites.
The highest rates of ice sheet retreat occurred across the flattest areas of the ice sheet’s bed. In flat-bedded areas, only a relatively small amount of melting, of around half a metre per day, is required to instigate a pulse of rapid retreat. Ice sheets in these regions are very lightly attached to their beds and therefore require only minimal amounts of melting to become fully buoyant, which can result in almost instantaneous retreat.
However, rapid “buoyancy-driven” retreat such as this is probably only sustained over short periods of time – from days to months – before a change in the ice sheet bed or ice surface slope farther inland puts the brakes on retreat. This demonstrates how nonlinear, or “pulsed”, the nature of ice sheet retreat was in the past.
This will likely also be the case in the future.
A warning from the past
Our findings reveal how quickly ice sheets are capable of retreating during periods of climate warming. We suggest that pulses of very rapid retreat, from tens to hundreds of metres per day, could take place across flat-bedded parts of the Antarctic Ice Sheet even under current rates of melting.
This has implications for the vast and potentially unstable Thwaites Glacier of West Antarctica. Since scientists began observing ice sheet changes via satellites, Thwaites Glacier has experienced considerable retreat and is now only 4km away from a flat area of its bed. Thwaites Glacier could therefore suffer pulses of rapid retreat in the near future.
Ice losses resulting from retreat across this flat region could accelerate the rate at which ice in the rest of the Thwaites drainage basin collapses into the ocean. The Thwaites drainage basin contains enough ice to raise global sea levels by approximately 65cm.
Our results shed new light on how ice sheets interact with their beds over different timescales. High rates of retreat can occur over decades to centuries where the bed of an ice sheet deepens inland. But we found that ice sheets on flat regions are most vulnerable to extremely rapid retreat over much shorter timescales.
Together with data about the shape of ice sheet beds, incorporating this short-term mechanism of retreat into computer simulations will be critical for accurately predicting rates of ice sheet change and sea-level rise in the future.
The recent report issued by the Intergovernmental Panel on Climate Change (IPCC) underscores the urgency of emissions reductions. For Aotearoa New Zealand, where 50% of emissions come from agriculture in the form of methane and nitrous oxide, this means the primary sector must be part of the response.
New Zealand is indeed the first country to investigate introducing a price on agricultural greenhouse gas emissions.
The most recent pricing proposals would require farmers to pay a levy on their agricultural emissions. To begin with, only 5% of emissions would be priced, with proposals to reduce the 95% free allocation gradually over time.
Much of the existing modelling shows emissions could be cut by up to 10% by reducing the intensity of production, often through lowering animal numbers and fertiliser use. This doesn’t necessarily mean lower profitability. With good pasture management, farmers may be able to reduce stocking rates and increase profits.
But Aotearoa is already one of the most efficient producers of meat and dairy products globally. If we reduce emissions here, will that not simply lead to other, less efficient countries picking up the lost production, while our farmers pay the price?
This idea is known as “carbon leakage” and is often used as an argument against any domestic policy that could result in reduced agricultural production. The issue is important as New Zealand depends heavily on agricultural exports. In 2022, of all merchandise trade, 65% were agricultural commodities.
Understanding whether carbon leakage will occur or not is a complex task. Here, we look at what evidence we have and insights from agricultural trade modelling.
New Zealand modelling
It’s difficult to know exactly what might happen in agriculture, as emissions pricing on agricultural products has not yet been used elsewhere. There is no historical evidence to draw on.
International modelling studies present a mixed picture of the likelihood of leakage: an OECD study estimated 34% of agricultural emissions would be leaked, mostly to developing countries.
Recent modelling for New Zealand examines a series of scenarios of domestic pricing on its own as well as international pricing. The results show that for the current proposal where only 5% of emissions are priced to begin with, with a 1% increase each year, New Zealand’s production of meat and dairy products could decline by 2050.
The effect on dairy producers would be a loss of returns of under 1%, while meat producers would face a 6% decline. Some of the production would be taken up by other countries, but the overall volume would be lower than in the baseline situation, where no emissions pricing existed.
This shows leakage may occur, with reductions in production of New Zealand dairy products. But global meat and dairy production by 2050 would be considerably lower than without the policy, which would have a positive overall impact on the climate.
As the proportion of emissions that are priced increases, we expect the quantity of meat and dairy produced in New Zealand to decrease. This in turn could increase the volume of leakage. –
More sustainable future diets
It is important to remember that although there is a reduction in meat and dairy production, there is likely to be an increase in the production of other types of food which doesn’t contribute so much to climate change.
A recent study shows how food consumption alone could contribute an additional degree of warming above preindustrial temperatures by 2100. This demonstrates the importance of food choices in addressing climate change.
Many of New Zealand’s trading partners are exploring and beginning to implement their own agricultural emissions-reduction goals and targets. Internationally, there is an increasing focus on the role international trade rules can play in addressing climate change, including border carbon adjustment mechanisms and environmental standards for imports.
In a similar scenario as described above, but where New Zealand’s main competitors also take action, New Zealand may actually see a small increase in production by 2050, despite the domestic pricing policy.
The extent of leakage therefore really depends on how other countries tackle their own emissions. Economy-wide net zero emissions targets are in place for Australia, Chile, European Union countries, the US and the UK by 2050, and for China by 2060.
New Zealand could decide to be a leader and demonstrate to the rest of the world a commitment to reducing emissions from our highest emitting sector. This may result in some leakage initially, but this would likely decline as other countries take similar action.
Or we can wait until other countries begin to take more serious action on agricultural emissions. But in the meantime, emissions reductions will increasingly be driven through finance and private-sector initiatives, for example through access to processing companies, which are progressively requiring emissions reductions throughout their value chains and through lending and finance, where banks are beginning to offer reduced interest rates for sustainable practices.