Impacts: Rising sea levels
Other sections
Home > Climate wiki > Impacts >

Rising sea levels
Summary
“…72,000 New Zealanders [are] currently exposed to present-day extreme coastal flooding, along with about 50,000 buildings worth $12.5 billion. The risk exposure increases markedly with sea-level rise, particularly during the first metre of rise, which means long-term planning to address the risk is urgent. There is near certainty that the sea will rise 20-30 cm by 2040.” – NIWA 2019
“A common response to increasing climate risk is to “harden the coasts” to defend property from inundation. However, engineering solutions like seawalls, stopbanks, and levees only delay damage at best and might even be counterproductive, as it encourages intensification in hazardous locations. Responses to sea level rise insurance retreat should attempt to eliminate the underlying risk by moving homes out of harm’s way. – Storey et al, 2020
- Sea levels rise relative to the land for many reasons (Fig. 8) including land sinking or rising (top image), sometimes during earthquakes like the Kaikoura quake (Video 1).
- Sea level rise due to climate change is accelerating because the ocean is warming and the cryosphere—Greenland and Antarctic icecaps, mountain glaciers and permafrost—is melting at an unprecedented pace.
- The IPCC models of sea level rise currently used by polymakers specifically exclude rapid and widespread melting now being observed in Antarctica and Greenland. This is like making a calculation of 1+0.1+?=1.1, where 1.1m is the current maximum estimate of sea level rise by 2100 and ? is missing data. The absence of date to fill in the unknown ? is stated clearly in the IPCC and New Zealand SeaRise tool, however this is often overlooked by the media and policymakers.
Continued improvements in numerical modeling and scientific understanding of ice sheet processes shows that the Greenland and Antarctica ice sheets are more sensitive to warming than previously thought, and have the potential to release greater and more rapid sea-level rise and at lower global mean temperatures than previously estimated. – State of the Cryosphere Report 2023
- There is also a lag time between rising temperatures and sea levels. We are already committed to a rise in sea-levels of multiple metres (Fig. 3), but the time frames are uncertain due to uncertainty around the tipping points of melting ice sheets. For example:
“The glacier in Greenland’s largest drainage basin is thinning and its flow is accelerating. Updated simulations suggest that sea-level rise will be up to five-fold higher than previously expected.“ – Khan et al, November 2022
“The opportunity to preserve the WAIS (West Antarctic Ice Sheet) in its present-day state has probably passed, and policymakers should be prepared for several metres of sea-level rise over the coming centuries.” – Naughten et al, October 2023
- For potential impacts on New Zealand, see SeaRise. Please read their disclaimers and exclusions and see Video 2.
- See also:
- ‘Response: retreating from coasts and rivers‘ (this website)
- Coastal Hazards and Climate Change guidance (MfE February 2024)
- Community-led retreat and adaptation funding: Issues and options (August 2023)
- Adaptation Plan for New Zealand (August 2022)
- Interim guidance on the use of new sea-level rise projections (August 2022)
- The national coastal-change database will be publicly available by the end of 2024
Other sections
Home > Climate wiki > Impacts >
Summary
“…72,000 New Zealanders [are] currently exposed to present-day extreme coastal flooding, along with about 50,000 buildings worth $12.5 billion. The risk exposure increases markedly with sea-level rise, particularly during the first metre of rise, which means long-term planning to address the risk is urgent. There is near certainty that the sea will rise 20-30 cm by 2040.” – NIWA 2019
“A common response to increasing climate risk is to “harden the coasts” to defend property from inundation. However, engineering solutions like seawalls, stopbanks, and levees only delay damage at best and might even be counterproductive, as it encourages intensification in hazardous locations. Responses to sea level rise insurance retreat should attempt to eliminate the underlying risk by moving homes out of harm’s way. – Storey et al, 2020
- Sea levels rise relative to the land for many reasons (Fig. 8) including land sinking or rising (top image), sometimes during earthquakes like the Kaikoura quake (Video 1).
- Sea level rise due to climate change is accelerating because the ocean is warming and the cryosphere—Greenland and Antarctic icecaps, mountain glaciers and permafrost—is melting at an unprecedented pace.
- The IPCC models of sea level rise currently used by polymakers specifically exclude rapid and widespread melting now being observed in Antarctica and Greenland. This is like making a calculation of 1+0.1+?=1.1, where 1.1m is the current maximum estimate of sea level rise by 2100 and ? is missing data. The absence of date to fill in the unknown ? is stated clearly in the IPCC and New Zealand SeaRise tool, however this is often overlooked by the media and policymakers.
Continued improvements in numerical modeling and scientific understanding of ice sheet processes shows that the Greenland and Antarctica ice sheets are more sensitive to warming than previously thought, and have the potential to release greater and more rapid sea-level rise and at lower global mean temperatures than previously estimated. – State of the Cryosphere Report 2023
- There is also a lag time between rising temperatures and sea levels. We are already committed to a rise in sea-levels of multiple metres (Fig. 3), but the time frames are uncertain due to uncertainty around the tipping points of melting ice sheets. For example:
“The glacier in Greenland’s largest drainage basin is thinning and its flow is accelerating. Updated simulations suggest that sea-level rise will be up to five-fold higher than previously expected.“ – Khan et al, November 2022
“The opportunity to preserve the WAIS (West Antarctic Ice Sheet) in its present-day state has probably passed, and policymakers should be prepared for several metres of sea-level rise over the coming centuries.” – Naughten et al, October 2023
- For potential impacts on New Zealand, see SeaRise. Please read their disclaimers and exclusions and see Video 2.
- See also:
- ‘Response: retreating from coasts and rivers‘ (this website)
- Coastal Hazards and Climate Change guidance (MfE February 2024)
- Community-led retreat and adaptation funding: Issues and options (August 2023)
- Adaptation Plan for New Zealand (August 2022)
- Interim guidance on the use of new sea-level rise projections (August 2022)
- The national coastal-change database will be publicly available by the end of 2024
Sea levels are constantly changing
Sea level is generally referred to as ‘mean sea level’ or ‘MSL’ because the height of the ocean relative to the land is constantly changing for a multitude of reasons (Fig. 8). Some changes, like waves and tides, are episodic and temporary. Others such as El Niño /La Niña and the episodic wobble of the Moon leading to higher than normal tides over longer periods, can last for months, while earthquakes can change the coast in minutes (Video 1) or over millennia.
“The data show that the subsidence we observed before the Kaikoura earthquake resumed within a year after the earthquake (in fact subsidence/sinking rates are much higher). So, while the land generally went up fast during the earthquake, it has since resumed subsiding. The earthqauke reset the coastline datum (instantaneously), but the pattern of long term subsidence continues.” – SeaRise FAQs
Sea levels driven by climate change
When the climate cools, eustatic (global) sea levels drop because rain and snow that falls on the land builds up into glaciers instead of being carried by rivers into the ocean. Glaciers eventually merge to become ice sheets several kilometres thick. At the same time, the ocean cools and contracts. Both if these result in sea levels dropping.
When the climate warms, glaciers and ice sheets on the land melt and drain into the ocean. At the same time, the ocean warms and expands, so sea levels rise.
Today, eustatic sea levels are rising because Earth’s climate is getting warmer. While this is a global change, sea levels are not the same everywhere because of local and regional factors including salinity, temperature, currents, gravity, and sinking coastlines (Fig. 8 & Videos 2 & 3). This means rising sea levels affect different coastlines in different ways.
Effects of sea level rise
Sea level rise does not look like the ocean coming at us… It looks like the groundwater coming up.” – Tada, 2020
- Flooding (temporary, generally poor drainage)
- Erosion
- Inundation (permanently drowned coastlines)
- Saltwater intrusion into rivers, hapua, and aquifers
- Inland migration or loss of estuaries and hapua depending on topographical constraints
- Changing coastal ecosystems; loss of biodiversity and mahinga kai
- Loss of insurance, property, and infrastructure
How high have global sea levels risen?
Fig 1: Instructions for interactive graphs (Credit: The 2°Institute.)
- Mouse over anywhere on the graphs to see the changes in global sea levels over the last thousand years.
- To see time periods of your choice, hold your mouse button down on one section then drag the mouse across a few years, then release it.
- To see how this compares to the past 800,000 years, click on the ‘time’ icon on the top left.
- To return the graphs to their original position, double-click the time icon.
Fig 1: Instructions for interactive graphs (Credit: The 2°Institute.)
- Mouse over anywhere on the graphs to see the changes in sea levels over the last thousand years.
- To see time periods of your choice, hold your mouse button down on one section then drag the mouse across a few years, then release it.
- To see how this compares to the past 800,000 years, click on the ‘time’ icon on the top left.
- To return the graphs to their original position, double-click the time icon.
How much higher will they rise?

“The models used by the Intergovernmental Panel on Climate Change predict a sea level rise contribution from Greenland of around 10 centimeters by 2100, with a worst-case scenario of 15 centimeters. But that prediction is at odds with what field scientists are witnessing from the ice sheet itself. According to our findings, Greenland will lose at least 3.3% of its ice, over 100 trillion metric tons. This loss is already committed – ice that must melt and calve icebergs to reestablish Greenland’s balance with prevailing climate.” – Alun Hubbard, Prof. of Glaciology, University of Tromsø, August 2022
“A sobering thought is that even if we somehow managed to turn global warming off right now, the atmosphere would keep warming for some years to come because of the heat that’s stored in the ocean.” – Dr Craig Stevens, NIWA
“The rate at which the warming Southern Ocean melts the West Antarctic ice sheet will speed up rapidly over the course of this century, regardless of how much emissions fall in coming decades, our new research suggests.” – Naughten et al, October 2023
“A sobering thought is that even if we somehow managed to turn global warming off right now, the atmosphere would keep warming for some years to come because of the heat that’s stored in the ocean.” – Dr Craig Stevens, NIWA

Updated (2022) estimates used by the Ministry for the Environment (MfE) explicitly exclude potential impacts resulting from the extraordinary rate of ice being lost in Greenland and Antarctica these past few years. This exclusion is because the effects have yet to be modelled. Absent these unknown impacts, MfE estimates are:
- 20cm – 30cm by 2040
- 50cm – 1.1m by 2100
Research and observations of melting ice sheets in Greenland and Antarctica summarised in 2023 State of the Cryosphere make it clear that if we don’t cut carbon emissions, we should plan for a minimum 2-metre rise this century.
We know sea-levels can rise even faster because 13-14,000 years ago, they rose as much as 2 metres in 50 years following a Meltwater Pulse Event (Video 7). Today, Earth is warming far faster (see ‘How hot could it get?‘).
Every coastline responds differently
Around New Zealand, coasts have built up over millennia by rivers that carried sand and gravel (alluvium) to the coast, ash and lava from volcanoes, peat and mud in wetlands and lagoons building up over time, and earthquakes that have lifted the land or ancient seabeds and coral reefs, or caused the land to drop.
In the future, as temperatures rise, storms will become stronger and waves are likely to become larger, so ‘soft shore’ coastlines—sand, gravel and rocks, mud, ash etc—will erode faster than hard rocky coastlines. In places where these ‘soft’ coasts are cliffs, such as South Taranaki and South Canterbury, rising sea levels means the waves will reach higher and further inland, undercutting the soft cliffs and causing them to collapse. Some of this eroded material may be carried along the shore by currents and washed up on nearby beaches, but the land above the cliffs will be lost (see Canterbury case studies) as shorelines recede.
Flooding: a risk multiplier
“By the end of the century, depending on whether global greenhouse gas emissions are reduced, it could rise by between 0.5 to 1.1 m, which could add an additional 116,000 people exposed to extreme coastal storm flooding.” – NIWA
Low-lying coasts near rivers are particularly vulnerable during storms. Low-pressure systems raise sea levels, storm waves are bigger that normal waves and reach further inland, and the water from rain-filled rivers and rain-drenched land can’t drain away. Together, this can result in widespread flooding inland as well as along coastlines, and much more intense coastal erosion.
Small sea-level rise increments of 10–20cm predicted to happen around the NZ coast in the next 20–30 years may not seem like much. But the number of times coastal areas are likely to flood is increased. According to NIWA the current exposure to coastal flooding across New Zealand is several billion dollars (Fig. 7).
Inundation maps: ‘bathtub’ estimates
Inundation maps are based on topography. They’re useful where a coastline is hard (like the edge of a bathtub), but they do not factor in how dynamic coastal processes (wind and waves, especially stormwaves) change the shape of sandy and gravel beaches, estuaries or hapua, how river flows will also change where these reform and migrate inland, or how much sand and gravel that high storm waves will erode and carry into water that’s too deep for smaller gentler waves or currents to bring back onshore.
Consequently, a 2m sea level rise ‘inundation map’ is not a true picture of what will happen. For example Fig. 4 is Pegasus soft shore coast (sand and gravel, not rock) along the Waimakariri coast. These types of coasts are like sandcastles. As sea levels rise, some ‘high’ areas such as dunes will be eroded and will not, as the image suggests, become islands. These maps also don’t factor in the effect of engineering works, such as sea-walls and groins.
See this map of Pegasus Bay showing the coastline as it was 9,500 years ago. If you live in Christchurch or the Banks Peninsula, see the city Councils’ risk hazard map here.


Current coastal flooding exposure by region: this risk increases as sea levels continue to rise

Reasons why sea levels change, and why they are not the same everywhere
Fig. 8 below: Sea levels rise and fall relative to the land for many reasons. Every strip of coastal land responds differently to the interplay between complex and ever-changing dynamic forces, from wind, waves and storms to melting ice caps, and rivers no longer delivering enough gravel to the coast, all of which need to be considered when making decisions about managing and living on or close to coastal environments. A national coastal-change database incorporating multiple elements will be publicly available by the end of 2024.
1
Eustatic: contribution from terrestrial cryosphere (melting and collapsing ice caps, glaciers, and permafrost) SeaRise.nz has mapped Aotearoa coasts
Global
Months to millennia
2
Thermosteric: thermal expansion of water due to global warming, horizontally constrained by landmasses, is forced to rise
Global rise
Months to millennia
3
Steric:* El Niño / La Niña Southern Oscillation (ENSO) and Southern Annular Mode (SAM)
Regional rise & fall
Months or longer
4
Steric: Interdecadal Pacific Oscillation (IPO)
Regional rise & fall
Decades
5
Thermosteric: local and regional seasonal temperature changes
Regional rise & fall
Seasonal
6
Halosteric (salinity): changes in volume of freshwater entering the ocean due to floods/melting ice and permafrost etc.
Local rise & fall
Seasonal
7
Chaotic interactions: seiche effect, e.g. 2 hours in Pegasus Bay.
Local rise & fall
2 -4 hours in Pegasus Bay
8
Atmospheric pressure: storms/cyclones
Regional rise & fall
Hours to days
9
Tides: lunar and solar
Regional rise & fall
Episodic daily
9
Tides: lunar and solar
Regional rise & fall
Episodic daily
10
Tsunami: tectonic & underwater landslides
Regional or local rise & fall
2 -4 hours in Pegasus Bay
11
Tectonic: earthquake, e.g. Kaikoura
Regional or local rise & fall
Seconds to minutes
12
Tectonic: volcanoes creating land (e.g. Iceland & Hawaii) or destroying land (e.g. Hunga Tonga-Hunga Ha’apai, not including the impacts of tsunamis)
Regional rise & fall
Minutes to millennia
13
Vertical land movement: land slowly rising or subsiding due to compression, slow earthquakes, water or oil extraction etc. SeaRise.nz has mapped Aotearoa coasts
Regional or local rise & fall
Minutes to millennia
14
Vertical land movement – Isostacy: the lithosphere (and sometimes the crust) is either compressed when a large load of ice (on land) or water (in the ocean) is added. It rebounds when ice or water is removed. The process is so slow that rebounding or compression may continue for thousands of years after weight is removed or added.
Regional rise & fall
Several millennia
15
Changes in terrestrial water storage: non-cryospheric water held in rivers, lakes, dams, and aquifers.
Global rise or fall
Decades to millennia
16
Gravitational: changes in local gravity due to mass changes in terrestrial ice-sheets. The impact is strong enough to affect Earth’s rotation.
Regional rise or fall
Centuries to millennia
17
Dynamic coastal processes – waves and swash: in general, possibly reduced along the Canterbury coast as the climate warms#, however more destructive storms waves possibly increased due to increasing storminess## NIWA coastal sensitivity index map.
Regional/local rise or fall
Hours to days
18
Dynamic coastal processes – sediment budget gravels from braided rivers restricted or carried into deep water means it becomes unavailable; excess = accretion; insufficient = erosion. NIWA coastal sensitivity index map.
Local rise or fall
Hours to millennia
19
Dynamic coastal processes – wind/vegetation: high winds over soft coastlines not vegetated with native plants erode. Well vegetated areas can do the opposite by accumulating sediment (accretion).
Local rise or fall
Hours to years
20
Dynamic coastal processes – currents: longshore transport of sediment.
Local rise or fall
Ongoing
* Thermosteric (heat) and halosteric (salinity) are together referred to as ‘steric’ changes. Where ocean waters are water and/or saltier (more dense), sea levels are higher relative to regions of cooler and/or less saline (less dense).
# 2022: Albuquerque et al; On the projected changes in New Zealand’s wave climate and its main drivers, New Zealand Journal of Marine and Freshwater Research ## 2022: Shaw et al; Stormier Southern Hemisphere induced by topography and ocean circulation, PNAS 119 |5 (also see Shaw, Guest post: Why the southern hemisphere is stormier than the northern Carbon Brief (open access plain English article on the above research).
New Zealand stories
Several well-research stories that cover the impacts on New Zealanders are published by Stuff, some using a storytelling multi-media platform. These stories breath life into what is now an everyday reality, not a distant problem, for many Kiwis:
- As sea levels rise, coastal areas will become uninhabitable. Who is going to pay?
- Beach Road: The rising sea and the reshaping of New Zealand
- Eaten Alive: The relentless sea is biting chunks out of a seaside town
- We’ll need to retreat from rising seas. A new law could set the path
- Beach-loving New Zealanders could face relocation within a decades


-
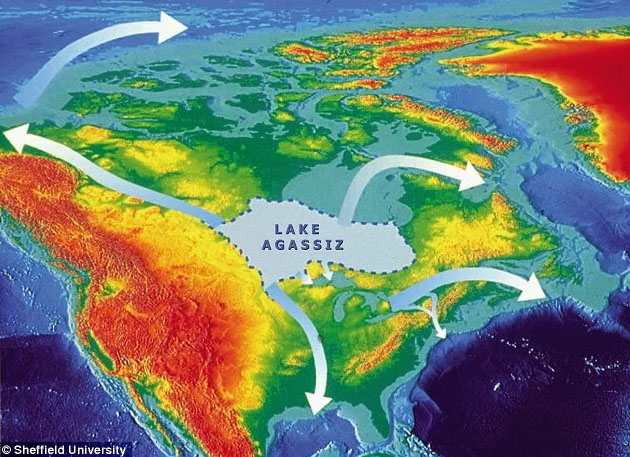
At the end of the last glacial (not the end of the ice age: we still are in the Pleistocene Ice Age) the ice sheets that covered much of the planet began to melt. While some meltwater flowed into the ocean, gradually raising sea levels, huge volumes of water also pooled into vast meltwater lakes dammed by the natural shape of the land, the (still melting) glaciers, and/or ice shelves along coasts. As the Earth continued to warm, the lakes kept filling until they eventually collapsed and burst open (Video) and the meltwater rushed into the ocean.
In other areas, coastal glaciers (ice shelves) collapsed, allowed glaciers and ice sheet covering the land to quickly disgorge into the ocean. These ‘Meltwater Pulses’ (MWP) raised sea levels rapidly. Some events, supported by geological evidence, match stories of great floods from the cultures known to have inhabited the affected regions at that time. This includes the land bridge between Alaska and Russia (Beringia) and the UK and Europe (Doggerland).
There is still some uncertainty about how many of these meltwater pulse events occurred, as sea levels continued to rise at different rates until about 4,500 years ago. After this date, sea level and the global climate remained relatively stable.
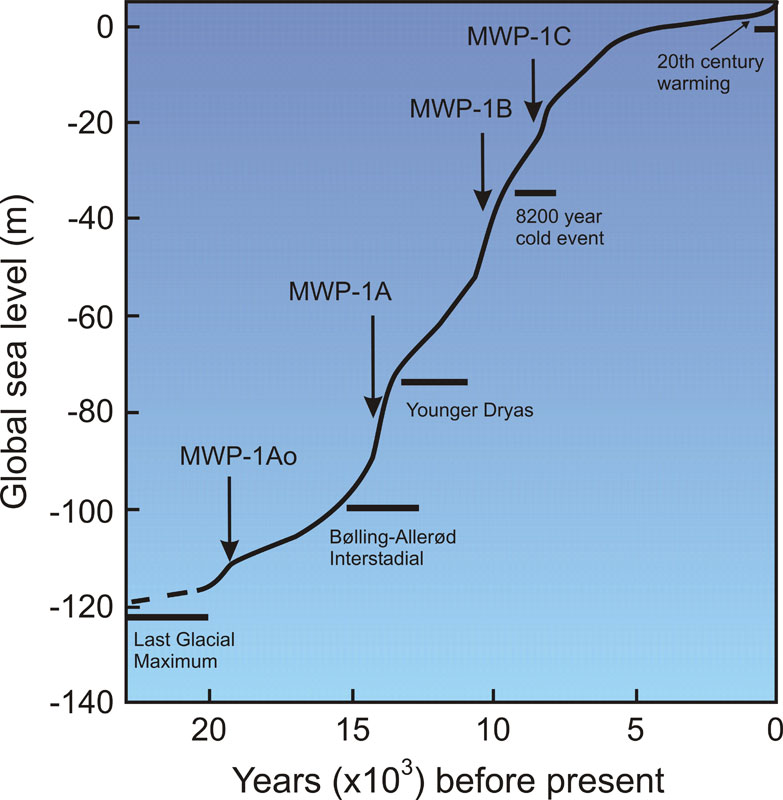
Some researchers suggest there may have been 15 or 16 MWP events between 17,500 and 4,500 years ago. The fastest appears to have been MWP-1A (Image below: NASA).
- MWP-1Ao: ~19,600 – 18,800 years ago sea levels rose at least 10 metres.
- MWP-1A: ~14,700 – 13,500 years ago sea levels rose 16 – 25 metres. Much of this occurred over a 400–500 year period. The average rate was 40–60 mm/year, however there were periods of extremely rapid rise of up to 4 metres/century, for several centuries.
- MWP-1B: ~11,300 – 11,000 years ago sea levels rose 40 – 80 metres.